Chapter 32: An Overview of Animal Diversity
Q32.1-1CC.
Summarize the main stages of animal development. What family of control genes plays a major role?
Q32.1-2CC.
What animal characteristics would be needed by an imaginary plant that could chase, capture, and digest its prey—yet could also extract nutrients from soil and conduct photosynthesis?
Q32-1TYU.
One of the characteristics unique to animals is
(A) gastrulation.
(B) multicellularity.
(C) sexual reproduction.
(D) flagellated sperm.
Q32.2-1CC.
Put the following milestones in animal evolution in order from oldest to most recent: (a) origin of mammals, (b) earliest evidence of terrestrial arthropods, (c) Ediacaran fauna, (d) extinction of large, nonflying dinosaurs.
Q32.2-3CC.
Evaluate whether the origin of cell-to-cell attachment proteins in animals illustrates descent with modification. (See Concept 22.2.)
Q32-2TYU.
The distinction between sponges and other animal phyla is based mainly on the absence versus the presence of
(A) a body cavity.
(B) a complete digestive tract.
(C) mesoderm.
(D) tissues.
Q32.3-1CC.
Distinguish the terms grade and clade.
Q32.3-2CC.
Compare three aspects of the early development of a snail (a mollusc) and a human (a chordate).
Q32.4-1CC.
Describe the evidence that cnidarians share a more recent common ancestor with other animals than with sponges.
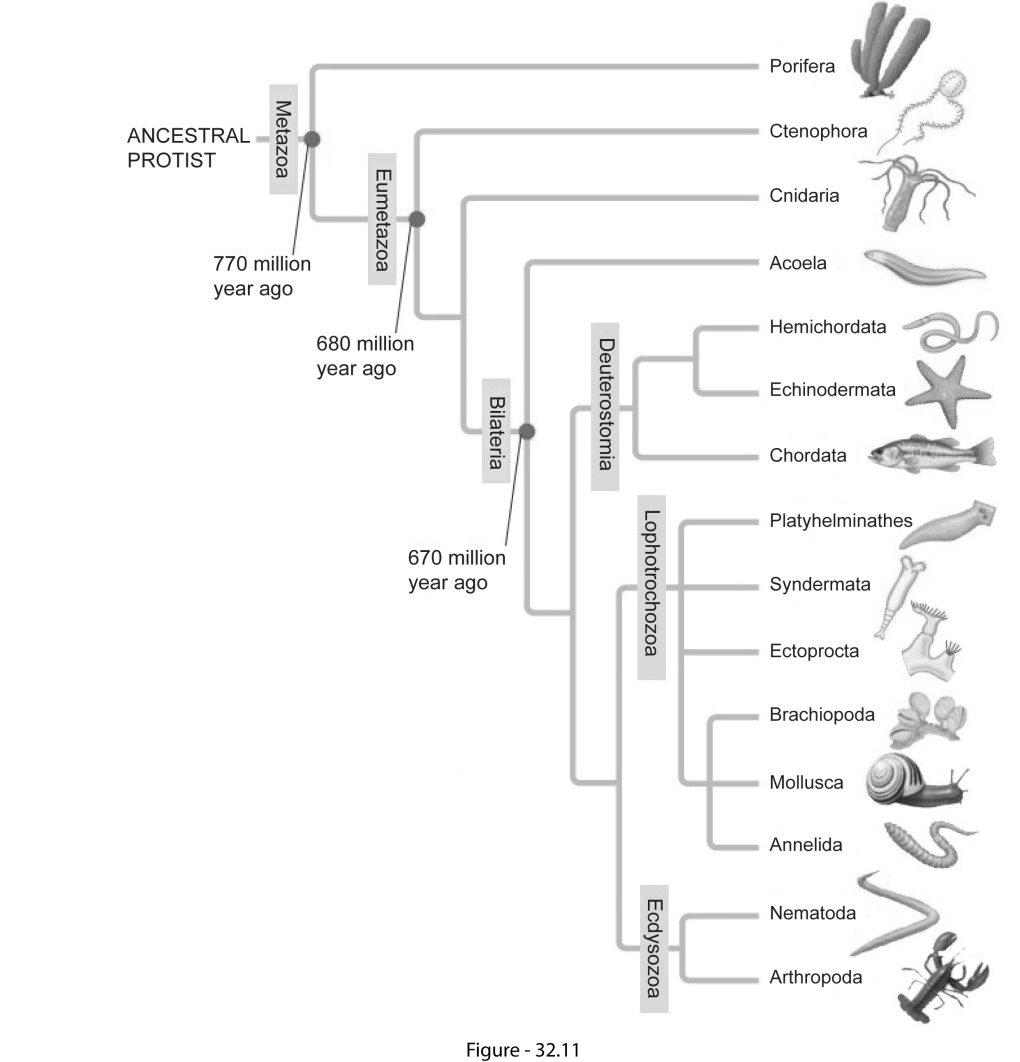
Q32.4-2CC.
WHAT IF? Suppose ctenophores are basal metazoans and sponges are the sister group of all remaining animals. Under this hypothesis, redraw Figure 32.11 and discuss whether animals with tissues would form a clade.