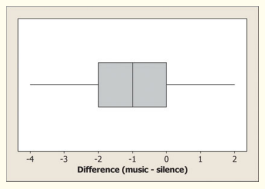
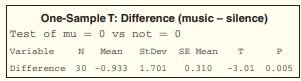
/*! This file is auto-generated */ .wp-block-button__link{color:#fff;background-color:#32373c;border-radius:9999px;box-shadow:none;text-decoration:none;padding:calc(.667em + 2px) calc(1.333em + 2px);font-size:1.125em}.wp-block-file__button{background:#32373c;color:#fff;text-decoration:none} Q.52 (a) Construct and interpret a 95... [FREE SOLUTION] | ÷ÈÓ°Ö±²¥

÷ÈÓ°Ö±²¥

(a) Construct and interpret a 95 % confidence interval for the true proportion p of all first-year students at the university who would identify being well-off as an important personal goal.

(b) Explain what the interval in part (a) tells you about whether the national value holds at this university.

Short Answer

Expert verified

a. The confidence interval is(0.59,0.73)

b. The national value holds at this university as the value lies in the interval

Step by step solution

01

Introduction

A confidence interval is the mean of your estimate in addition to and minus the variation in that estimate. This is the scope of values you anticipate that your estimate should fall between if you re-try your test, within a certain degree of confidence. Confidence, in statistics, is one more method for describing probability.

02

Explanation Part (a)

The number of students is n = 200

Number of students in favour of well being x = 132

population proportion 73%=0.73

p-=xn=132200=0.66

Using,

CI=p-±zα/2×p-(1−p-)n

CI=0.73±1.96×0.73(1-0.73)200

CI=(0.59,0.73)

03

Explanation Part (b)

The national value holds at this university as the value 0.73 lies in the interval.

Unlock Step-by-Step Solutions & Ace Your Exams!

  • Full Textbook Solutions

    Get detailed explanations and key concepts

  • Unlimited Al creation

    Al flashcards, explanations, exams and more...

  • Ads-free access

    To over 500 millions flashcards

  • Money-back guarantee

    We refund you if you fail your exam.

Over 30 million students worldwide already upgrade their learning with ÷ÈÓ°Ö±²¥!

One App. One Place for Learning.

All the tools & learning materials you need for study success - in one app.

Get started for free

Most popular questions from this chapter

Spinning for apples (6,3 or 7.3) In the "Ask Marilyn" column of Parade magzine, a reader posed this question: "Say that a slot machine has five wheels, and each wheel has five symbols: an apple, a grape, a peach, a pear, and a plum. I pull the lever five times. What are the chances that I'll get at least one apple?" Suppose that the wheels spin independently and that the fre symbols are equally likely to appear on each wheel in a given spin.

(a) Find the probability that the slot player gets at least one apple in one pull of the lever. Show your method clearly.

(b) Now answer the reader's question. Show your method clearly.

Refer to Exercise 1. In Simon’s SRS, 16 of the students were left-handed. A significance test yields a P-value of 0.2184.

(a) Interpret this result in context.

(b) Do the data provide convincing evidence against the null hypothesis? Explain.

A test of H0:p=0.65against Ha:p<0.65has test statistic z = -1.78.

(a) What conclusion would you draw at the 5% significance level? At the 1% level?

(b) If the alternative hypothesis were H0:p=0.65, what conclusion would you draw at the 5% significance level? At the 1% level?

Growing tomatoes An agricultural field trial compares the yield of two varieties of tomatoes for commercial use. Researchers randomly selected 10Variety A and 10 Variety B tomato plants. Then the researchers divide in half each 10 small plots of land in different locations. For each plot, a coin toss determines which half of the plot gets a Variety A plant; a Variety B plant goes in the other half. After harvest, they compare the yield in pounds for the plants at each location. The 10differences (VarietyA-VarietyB) give x=0.34andsx=0.83. A graph of the differences looks roughly symmetric and single-peaked with no outliers. Is there convincing evidence that Variety A has a higher mean yield? Perform a significance test using α=0.05to answer the question.

Does listening to music while studying help or hinder students’ learning? Two AP Statistics students designed an experiment to find out. They selected a random sample of 30students from their medium-sized high school to participate. Each subject was given10minutes to memorize two different lists of 20words, once while listening to music and once in silence. The order of the two word lists was determined at random; so was the order of the treatments. A boxplot of the differences in the number of words recalled (music- silent) is shown below, along with some Minitab output from a one-sample t test. Perform a complete analysis of the students’ data. Include a confidence interval.

See all solutions

Recommended explanations on Math Textbooks

View all explanations

What do you think about this solution?

We value your feedback to improve our textbook solutions.

Study anywhere. Anytime. Across all devices.