Chapter 12: More about Regression
Q. 1
A major agricultural company is testing a newvariety of wheat to determine whether it is more resistant tocertain insects than is the current wheat variety. The pro-portion of a current wheat crop lost to insects is . Thus,the company wishes to test the following hypotheses:
Which of the following significance levels and sample sizes
would lead to the highest power for this test?
Q. 1
Which of the following is not one of the conditions that must be satisfied in order to perform inference about the slope of a least-squares regression line? (a) For each value of x, the population of y-values is Normally distributed.
(b) The standard deviation of the population of y-values corresponding to a particular value of x is always the same, regardless of the specific value of x. (c) The sample size—that is, the number of paired observations (x, y)—exceeds .
(d) There exists a straight line such that, for each value of x, the mean of the corresponding population of y-values lies on that straight line.
(e) The data come from a random sample or a randomized experiment.
Q. 1
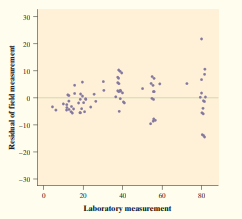
Oil and residuals Exercise 59 on page 193 (Chapter 3) examined data on the depth of small defects in the Trans-Alaska Oil Pipeline. Researchers compared the results of measurements on 100 defects made in the field with measurements of the same defects made in the laboratory. The figure below shows a residual plot for the least-squares regression line based on these data. Are the conditions for performing inference about the slope of the population regression line met? Justify your answer.
Q. 10
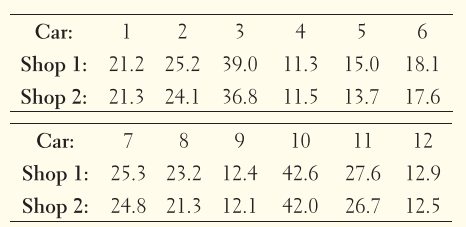
Insurance adjusters are always vigilant about being overcharged for accident repairs. The adjusters suspect that Repair Shop quotes higher estimates than Repair Shop . To check their suspicion,
the adjusters randomly select cars that were recently involved in an accident and then take each of the cars to both repair shops to obtain separate estimates of the cost to fix the vehicle. The
estimates are given below in hundreds of dollars.
Assuming that the conditions for inference are reasonably met, which of the following significance tests could legitimately be used to determine whether the adjusters’ suspicion is correct?
I. A paired test
II. A two-sample test
III. A t test to see if the slope of the population regression line is .
(a) I only
(b) II only
(c) I and III
(d) II and III
(e) I, II, and III
Q. 10
We record data on the population of a particular country from to . A scatterplot reveals a clear curved relationship between population and year. However, a different scatterplot reveals a strong linear relationship between the logarithm (base 10) of the population and the year. The least-squares regression line for the transformed data is,
log ( population) (years).
Based on this equation, the population of the country in the year 2020 should be about
(a)
(b)
(c)
(d)
(e) .
Q. 10
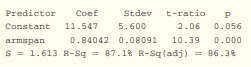
Ideal proportions The students in Mr. Shenk's class measured the arm spans and heights (in inches) of a random sample of 18 students from their large high school. Some computer output from a least-squares regression analysis on these data is shown below. Construct and interpret a 90% confidence interval for the slope of the population regression line. Assume that the conditions for performing inference are met.
Q. 11
A survey firm wants to ask a random sample of adults in Ohio if they support an increase in the state sales tax from % to , with the additional revenue going to education. Let denote the proportion in the sample who say that they support the increase. Suppose that of all adults in Ohio support the increase. How large a sample would be needed to guarantee that the standard deviation of is no more than ?
(a)
(b)
(c)
(d)
(e)
Q. 11
Growth hormones are often used to increase the weight gain of chickens. In an experiment using chickens, five different doses of growth hormone (, , , , and milligrams) were injected into chickens (chickens were randomly assigned to each dose), and the subsequent weight gain (in ounces) was recorded. A researcher plots the data and finds that a linear relationship appears to hold. Computer output from a least-squares regression analysis for these data is shown below.
role="math" localid="1652870715985"
(a) What is the equation of the least-squares regression line for these data? Define any variables you use.
(b) Interpret each of the following in context:
(i) The slope
(ii) The intercept
(iii)
(iv) The standard error of the slope
(v)
(c) Assume that the conditions for performing inference about the slope B of the true regression line are met. Do the data provide convincing evidence of a linear relationship between dose and weight gain? Carry out a significance test at the A level.
(d) Construct and interpret a confidence interval for the slope parameter.
Q.1.1
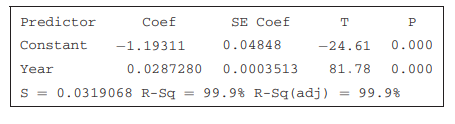
Explain why it would be reasonable to use an exponential model to describe the relationship between the U.S. population in the years to and the number of years since . Here is some Minitab output from a linear regression analysis on the transformed data.
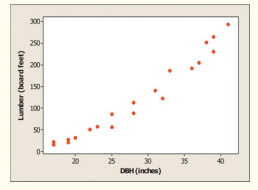
Q. 12
Foresters are interested in predicting the amount of usable lumber they can harvest from various tree species. They collect data on the diameter at breast height (DBH) in inches and the yield in board feet of a random sample of Ponderosa pine trees that have been harvested. (Note that a board foot is defined as a piece of lumber inches by inches by inch.) A scatterplot of the data is shown below
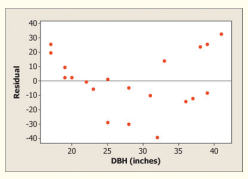
(a) Some computer output and a residual plot from a least squares regression on these data appear below. Explain why a linear model may not be appropriate in this case.
(B) Use both models to predict the amount of usable lumber from a Ponderosa pine with diameter inches. Show your work.
(c) Which of the predictions in part (b) seems more reliable? Give appropriate evidence to support your choice.
