Chapter 6: Q.15 (page 355)
Spell-checking Refer to Exercise 3. Calculate and interpret the standard deviation of the random variable . Show your work
Short Answer
Expert verified
The number of nonword errors is on average words from the mean.
Step by step solution
01
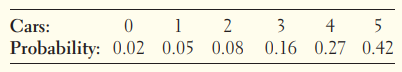
Given Information
The distribution of the number of nonword errors is as follows:

02
Explanation
The expected value is calculated by multiplying each possibility by its probability:
The expected value of the squared variation from the mean is the variance:
The square root of the variance is the standard deviation:
Over 30 million students worldwide already upgrade their learning with ��Ӱֱ��!