/*! This file is auto-generated */ .wp-block-button__link{color:#fff;background-color:#32373c;border-radius:9999px;box-shadow:none;text-decoration:none;padding:calc(.667em + 2px) calc(1.333em + 2px);font-size:1.125em}.wp-block-file__button{background:#32373c;color:#fff;text-decoration:none} Q. 19 19. Housing in San Jose How do r... [FREE SOLUTION] | ÷ÈÓ°Ö±²¥

÷ÈÓ°Ö±²¥

19. Housing in San Jose How do rented housing units differ from units occupied by their owners? Here are the distributions of the number of rooms for owner-occupied units and renter-occupied units in San Jose,
California:

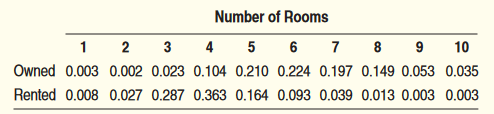
Let X = the number of rooms in a randomly selected owner-occupied unit and Y = the number of rooms in a randomly chosen renter-occupied unit.
(a) Make histograms suitable for comparing the probability distributions of X and Y. Describe any differences that you observe.
(b) Find the mean number of rooms for both types of housing unit. Explain why this difference makes sense.
(c) Find the standard deviations of both X and Y. Explain why this difference makes sense.

Short Answer

Expert verified

(a) Owners have better rooms than renters. Distribution for owners is roughly symmetric, while the allocation for renters is right-skewed.

(b) The mean for house owned is 6.280and for house rented is 4.187.

(c) The standard deviation of both Xand Yare 1.63 and 1.31.

Step by step solution

01

Part (a) Step 1: Given information 

Given in the question is a table , we have to consider X=the number of rooms in a randomly selected owner-occupied unit and Y=the number of rooms in a randomly chosen renter-occupied unit.

We need to make histograms suitable for comparing the probability distributions of Xand Y.

02

Part (a) Step 2: Graphical Representation 

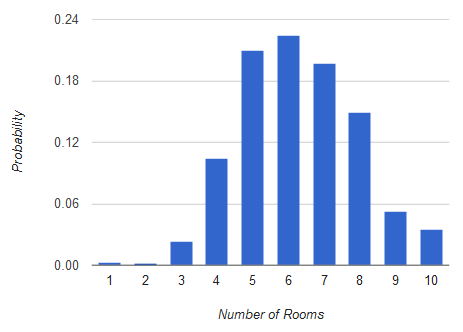
Housing in San Joise had the following histograms:

03

Part (a) Step 3: Graphical Representation

The histogram for rented housing in San Joise is as follows:

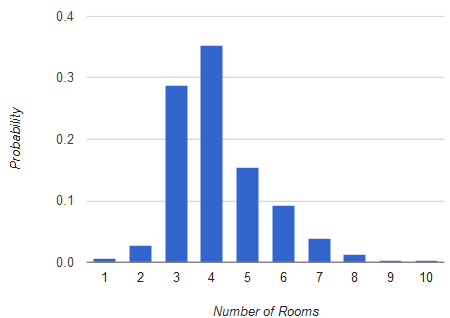
According to the graph, the owners have more rooms than the tenants. Owned has a generally symmetric distribution, while rented has a roughly right-skewed distribution.

The owned center has about six rooms, whereas the rented facility has about four rooms. Both histograms have nearly the same spread.

04

Part (b) Step 1: Given information 

Given in the question that, the distributions of the number of rooms for owner-occupied units and renter-occupied units in San Jose.

We have to find the mean number of rooms for both types of housing unit.

05

Part (b) Step 2: Explanation 

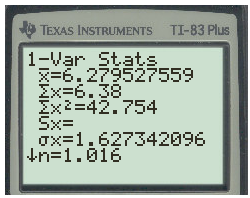
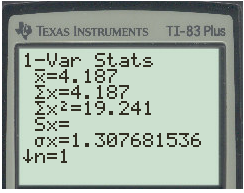
Let's compute the mean for house owned by using the Ti-83 calculator as follow:

Compute the mean for a rental residence using the Ti-83 calculator as follows:

Because of the different types of distributions, there is a discrepancy in the two means.

06

Part (c) Step 1: Given information 

Given in the question that, the distributions of the number of rooms for owner-occupied units and renter-occupied units in San Jose,

We have to compute the value for the standard deviations of both Xand Y.

07

Part (c) Step 2: Explanation 

To compute standard deviation, use the calculator Ti-83 as follows:

Unlock Step-by-Step Solutions & Ace Your Exams!

  • Full Textbook Solutions

    Get detailed explanations and key concepts

  • Unlimited Al creation

    Al flashcards, explanations, exams and more...

  • Ads-free access

    To over 500 millions flashcards

  • Money-back guarantee

    We refund you if you fail your exam.

Over 30 million students worldwide already upgrade their learning with ÷ÈÓ°Ö±²¥!

One App. One Place for Learning.

All the tools & learning materials you need for study success - in one app.

Get started for free

Most popular questions from this chapter

Ms. Hall gave her class a 10-question multiple-choice quiz. Let X=the number of questions that a randomly selected student in the class answered correctly. The computer output below gives information about the probability distribution of X. To determine each student’s grade on the quiz (out of localid="1649489099543" 100), Ms. Hall will multiply his or her number of correct answers by 10. Let localid="1649489106434" G=the grade of a randomly chosen student in the class.

localid="1649489113566" NMeanMedianStDevMinMaxQ1Q3307.68.51.3241089

(a) Find the mean of localid="1649489121120" G. Show your method.

(b) Find the standard deviation of localid="1649489127059" G. Show your method.

(c) How do the variance of localid="1649489132289" Xand the variance oflocalid="1649489138146" Gcompare? Justify your answer.

Suppose you roll a pair of fair, six-sided dice until you get doubles. Let T=the number of rolls it takes.

Find P(T=3). Interpret this result in context.

87. Airport security The Transportation Security Administration (TSA) is responsible for airport safety. On some flights, TSA officers randomly select
passengers for an extra security check before boarding. One such flight had 76±è²¹²õ²õ±ð²Ô²µ±ð°ù²õ—12in first class and 64in coach class. Some passengers were surprised when none of the 10 passengers chosen for
screening were seated in first class. Can we use a binomial distribution to approximate this probability? Justify your answer.

78. Rhubarb Refer to Exercise 76. Would you be surprised if 3 or more of the plants in the bundle die before producing any rhubarb? Calculate an appropriate probability to support your answer.

While he was a prisoner of war during World War II, John Kerrich tossed a coin 10,000times. He got5067heads. If the coin is perfectly balanced, the probability of a head is 0.5.

(a) Find the mean and the standard deviation of the number of heads in 10,000tosses, assuming the coin is perfectly balanced.

(b) Explain why the Normal approximation is appropriate for calculating probabilities involving the number of heads in 10,000tosses.

(c) Is there reason to think that Kerrich’s coin was not balanced? To answer this question, use a Normal distribution to estimate the probability that tossing a balanced coin 10,000times would give a count of heads at least this far from 5000(that is, at least5067 heads or no more than 4933 heads

See all solutions

Recommended explanations on Math Textbooks

View all explanations

What do you think about this solution?

We value your feedback to improve our textbook solutions.

Study anywhere. Anytime. Across all devices.