Chapter 10: Q. 33 (page 671)
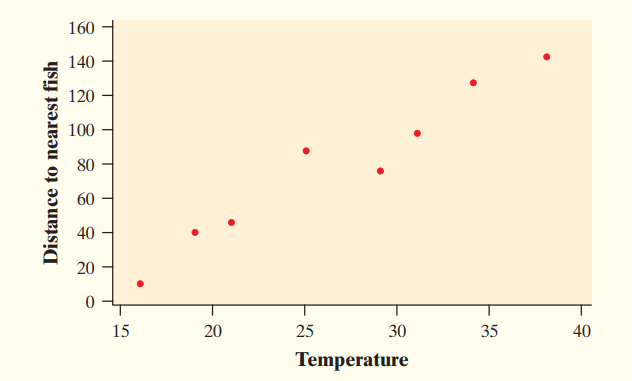
A nuclear power plant releases water into a nearby lake every afternoon at p.m. Environmental researchers are concerned that fish are being driven away from the area around the plant. They believe that the temperature of the water discharged may be a factor. The scatterplot below shows the temperature of the water (°C) released by the plant and the measured distance (in meters) from the outflow pipe of the plant to the nearest fish found in the water on eight randomly chosen afternoons.
Computer output from a least-squares regression analysis on these data is shown below.
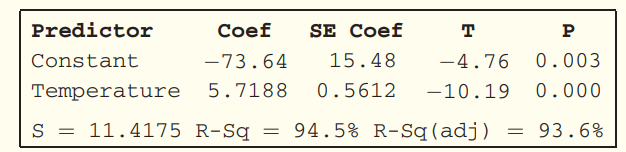
(a) Write the equation of the least-squares regression line. Define any variables you use.
(b) Interpret the slope of the regression line in context.
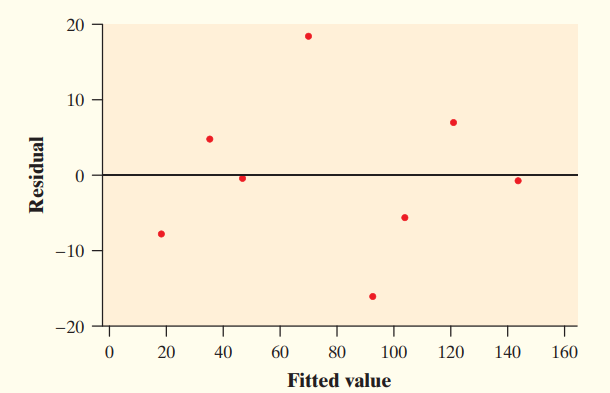
(c) A residual plot for the regression is shown on the next page. Is a linear model appropriate for describing the relationship between temperature and distance to the nearest fish? Justify your answer.
(d) Does the linear model in part (a) overpredict or underpredict the measured distance from the outflow pipe to the nearest fish found in the water for a temperature of ? Explain your reasoning.
Short Answer
(a) The equation least square regression line is
(b) The slope of the equation is .
(c)The linear model is appropriate for the graph.
(d)The residual value is negative so predicted value will be high.
Step by step solution
Over 30 million students worldwide already upgrade their learning with ��Ӱֱ��!

 (a) The slope will decrease, and the correlation will decrease.