
 Explanations
  Textbooks
  Flashcards
  魅影直播 AI
  Notes
Notes  Study Plans
  Study Sets
  Find a degree
  Magazine
 Chapter 1: Q67SE (page 48)
Aortic stenosis refers to a narrowing of the aortic valve in the heart. The article 鈥淐orrelation Analysis of Stenotic Aortic Valve Flow Patterns Using PhaseContrast MRI鈥� (Annals of Biomed. Engr., 2005: 878鈥�887) gave the following data on aortic root diameter (cm) and gender for a sample of patients having various degrees of aortic stenosis:
M: 3.7 3.4 3.7 4.0 3.9 3.8 3.4 3.6 3.1 4.0 3.4 3.8 3.5
F: 3.8 2.6 3.2 3.0 4.3 3.5 3.1 3.1 3.2 3.0
- Compare and contrast the diameter observations for
the two genders. - Calculate a 10% trimmed mean for each of the two
samples, and compare to other measures of center
(for the male sample, the interpolation method men-
tioned in Section 1.3 must be used).
Short Answer
a.
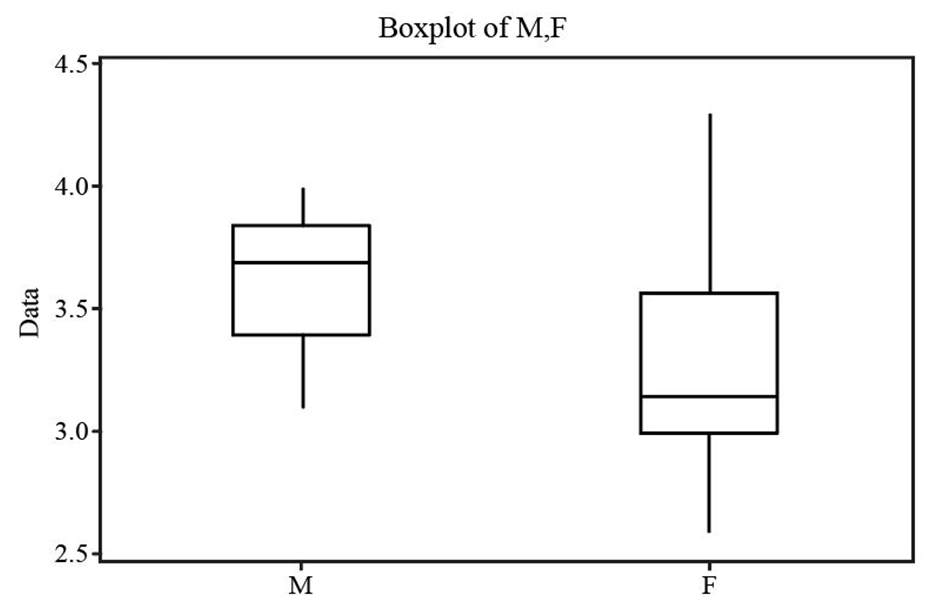
According to the comparative boxplot,the distribution is slightly negative skewed for female group while it is positive skewed for the male group.
b. 3.647 and 3.237
Step by step solution
Given information
The data are provided that consists of 16 observations on milk selenium concentration (mg/L) for samples of cows given a selenium supplement and a control sample given no supplement, both initially and after a 9-day period.
Arrange the samples of Male and Female in an ascending order.
The following table represent the ordered Male and Female samples:
M | 3.1 | 3.4 | 3.4 | 3.4 | 3.5 | 3.6 | 3.7 | 3.7 | 3.8 | 3.8 | 3.9 | 4.0 | 4.0 |
F | 2.6 | 3.0 | 3.0 | 3.1 | 3.1 | 3.2 | 3.2 | 3.5 | 3.8 | 4.3 | |||
Compute sample means of Supplement group and Control group.
The sample mean is computed using the formula,
\(\bar x = \frac{{\sum\limits_{i = 1}^n {{x_i}} }}{n}\)
Let \({\bar x_M}\) and \({\bar x_F}\) are the two required sample means. The sample size of male group is 13 while the sample size of female group is 10. The mean of each sample can be determined as follows:
\(\begin{aligned}{{\bar x}_M} &= \frac{{\sum\limits_{i = 1}^{13} {{x_i}} }}{{13}}\\ &= \frac{{\left( {3.1 + 3.4 + \ldots + 4.0 + 4.0} \right)}}{{13}}\\ &= \frac{{47.3}}{{13}}\\ &= 3.638\end{aligned}\)
\(\begin{aligned}{{\bar x}_F} &= \frac{{\sum\limits_{i = 1}^{10} {{x_i}} }}{{10}}\\ &= \frac{{\left( {2.6 + 3 + \ldots + 3.8 + 4.3} \right)}}{{10}}\\ &= \frac{{32.8}}{{10}}\\ &= 3.28\end{aligned}\)
Compute sample standard deviations of Males and Females
The sample standard deviation is computed using the formula,
\(s = \sqrt {\frac{{\sum\limits_{i = 1}^n {{{\left( {{x_i} - \bar x} \right)}^2}} }}{{n - 1}}} \)
Let \({s_M}\)and\({s_F}\) are two standard deviations. Each sample standard deviation can be calculated as,
\(\begin{aligned}{s_M} &= \sqrt {\frac{{\sum\limits_{n = 1}^{13} {{{\left( {{x_i} - 3.638} \right)}^2}} }}{{13 - 1}}} \\ &= \sqrt {\frac{{{{\left( {3.1 - 3.638} \right)}^2} + \ldots + {{\left( {4 - 3.638} \right)}^2}}}{{13 - 1}}} \\ &= 0.27\end{aligned}\)
\(\begin{aligned}{s_F} &= \sqrt {\frac{{\sum\limits_{n = 1}^{10} {{{\left( {{x_i} - 3.28} \right)}^2}} }}{{10 - 1}}} \\ &= \sqrt {\frac{{{{\left( {2.6 - 3.28} \right)}^2} + \ldots + {{\left( {4.3 - 3.28} \right)}^2}}}{{10 - 1}}} \\ &= 0.47\end{aligned}\)
Compute five-number summary for Male group
The five-number summary are smallest \({x_i}\), lower fourth, median, upper fourth and largest \({x_i}\).Since sample size of test is odd, the median is the\({\left( {\frac{{n + 1}}{2}} \right)^{th}}\) ordered value when the data are in ascending order as below.
M | 3.1 | 3.4 | 3.4 | 3.4 | 3.5 | 3.6 | 3.7 | 3.7 | 3.8 | 3.8 | 3.9 | 4.0 | 4.0 |
The smallest value is: 3.1 and the largest value is: 4.
Let \({\tilde x_M}\) be the required median. Use the formula to calculate median,
\(\tilde x = {\left( {\frac{{n + 1}}{2}} \right)^{th}}\,ordered\,value\)
\(\begin{aligned}{{\tilde x}_M} &= {\left( {\frac{{13 + 1}}{2}} \right)^{th}}\,ordered\,value\\ &= {7^{th}}\,ordered\,value\\ &= 3.7\end{aligned}\)
Therefore, the median of supplement group is 3.7
The lower fourth is the median of smallest half of the data as the median of the data is\({\tilde x_M} = 3.7\)so the lower half contains 7 values.
3.1 | 3.4 | 3.4 | 3.4 | 3.5 | 3.6 | 3.7 |
Since \(n = 7\)is odd, calculate the median using the formula:
\(\tilde x = {\left( {\frac{{n + 1}}{2}} \right)^{th}}\,ordered\,value\)
\(\begin{aligned}\tilde x &= {\left( {\frac{{7 + 1}}{2}} \right)^{th}}\,ordered\,value\\ &= {4^{th}}\,ordered\,value\\ &= 3.4\end{aligned}\)
Similarly, the upper fourth is the median of largest half of the data as the median of the data is\({\tilde x_M} = 3.7\)so it contains 6 values.
3.7 | 3.8 | 3.8 | 3.9 | 4.0 | 4.0 |
Since \(n = 6\)is even, calculate the median using the formula:
\(\tilde x = \frac{{\left( {{{\left( {\frac{n}{2}} \right)}^{th}}ordered\,value + {{\left( {\frac{n}{2} + 1} \right)}^{th}}\,ordered\,value} \right)}}{2}\)
\(\begin{aligned}\tilde x &= \frac{{\left( {{{\left( {\frac{6}{2}} \right)}^{th}}ordered\,value + {{\left( {\frac{6}{2} + 1} \right)}^{th}}ordered\,value} \right)}}{2}\\ &= \frac{{\left( {{3^{th}}ordered\,value + {4^{th}}ordered\,value} \right)}}{2}\\ &= \frac{{\left( {3.8 + 3.9} \right)}}{2}\\ &= 3.85\end{aligned}\)
Thus, the five-number summary to construct boxplot are as follows:
Smallest \({x_i}\): 3.1, lower fourth: 3.4, median: 3.7, upper fourth: 3.85,
Largest \({x_i}\): 4.0.
Compute five-number summary for Female group
The five-number summary are smallest \({x_i}\), lower fourth, median, upper fourth and largest \({x_i}\).Since sample size of test is even, the median is the average of\({\left( {\frac{n}{2}} \right)^{th}}\)and\({\left( {\frac{n}{2} + 1} \right)^{th}}\) ordered value when the data are in ascending order as below.
F | 2.6 | 3.0 | 3.0 | 3.1 | 3.1 | 3.2 | 3.2 | 3.5 | 3.8 | 4.3 |
The smallest value is: 2.6 and the largest value is: 4.3.
Let \({\tilde x_F}\) be the required median. Use the formula to calculate median,
\(\tilde x = \frac{{{{\left( {\frac{n}{2}} \right)}^{th}}ordered\,value + {{\left( {\frac{{n + 1}}{2}} \right)}^{th}}ordered\,value\,}}{2}\)
\(\begin{aligned}{{\tilde x}_F} &= \frac{{\left( {\left( {\frac{{10}}{2}} \right)\,ordered\,value + {{\left( {\frac{{10}}{2} + 1} \right)}^{th}}\,ordered\,value} \right)}}{2}\\ &= \frac{{\left( {{5^{th}}\,ordered\,value + {6^{th}}\,ordered\,value} \right)}}{2}\\ &= \frac{{3.1 + 3.2}}{2}\\ &= 3.15\end{aligned}\)
Therefore, the median of Female group is 3.15.
The lower fourth is the median of smallest half of the data as the median of the data is \({\tilde x_F} = 3.15\) so the lower half contains 5 values.
2.6 | 3.0 | 3.0 | 3.1 | 3.1 |
Since \(n = 5\)is odd, calculate the median using the formula:
\(\tilde x = {\left( {\frac{{n + 1}}{2}} \right)^{th}}\,ordered\,value\)
\(\begin{aligned}\tilde x &= {\left( {\frac{{5 + 1}}{2}} \right)^{th}}\,ordered\,value\\ &= {3^{rd}}\,ordered\,value\\ &= 3.0\end{aligned}\)
Similarly, the upper fourth is the median of largest half of the data as the median of the data is\({\tilde x_F} = 3.15\) so the upper half also contain 5 values.
3.2 | 3.2 | 3.5 | 3.8 | 4.3 |
Since \(n = 5\)is odd, calculate the median using the formula:
\(\tilde x = {\left( {\frac{{n + 1}}{2}} \right)^{th}}\,ordered\,value\)
\(\begin{aligned}\tilde x &= {\left( {\frac{{5 + 1}}{2}} \right)^{th}}\,ordered\,value\\ &= {3^{rd}}\,ordered\,value\\ &= 3.5\end{aligned}\)
Thus, the five-number summary to construct comparative boxplot are as follows:
Smallest \({x_i}\): 2.6, lower fourth: 3.0, median: 3.15, upper fourth: 3.5,
Largest \({x_i}\): 4.3.
Construct a comparative box plot for the given data
Following are the steps to make comparative boxplot by hand:
- Draw a plot line of range 8 to 12.
- Draw three horizontal lines that consists of first quartile, second quartile and third quartile and make two vertical lines to make it in rectangular form like a box for Supplement group.
- Do the Step 2 again for Control group.
- Draw whiskers on both sides of two boxplots and set the minimum and maximum value with respect to the obtained lower fence and upper fence.
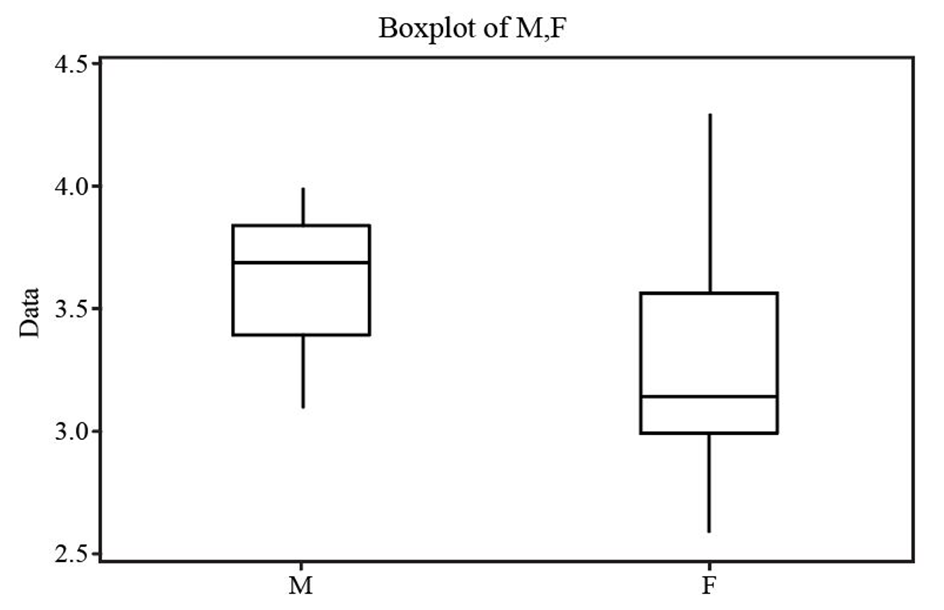
From the comparative boxplot, it is observe that the variability is less for the Male sample than the Female group. From the box plot of Males, there is no outlier and the middle value line is near 3.7 that is the median of data. The distribution is slightly negative skewed. From the box plot of Females, there is no outlier and the middle value line is near 3.15 that is the median of data. The distribution is slightly positive skewed.
Compute 10% trimmed mean for Male group
Let \(\bar x_{Tr\left( {10} \right)}^M\)be the required trimmed mean. The trimmed value is calculated by multiplying the sample size and given trimming percentage i.e. 10%.
\(13\left( {0.10} \right) = 1.3\)
Since 1.3 is not an integer so eliminate 1 and 2 values from the male sample and then interpolate between the resulted trimmed means. Therefore, the trimmed values are 1 and 2. Ignore one observation for first trimmed mean and two observations for second trimmed means. At last, calculate the mean of remaining data.
The trimming percentages are \(100 \times \frac{1}{{13}} = 7.692\% \)and \(100 \times \frac{2}{{13}} = 15.385\% \).
The remaining data after trimming one value from both sides are as follows:
M | 3.4 | 3.4 | 3.4 | 3.5 | 3.6 | 3.7 | 3.7 | 3.8 | 3.8 | 3.9 | 4.0 |
The remaining data after trimming two value from both sides are as follows:
M | 3.4 | 3.4 | 3.5 | 3.6 | 3.7 | 3.7 | 3.8 | 3.8 | 3.9 |
Compute \(\bar x_{Tr\left( {7.692} \right)}^M\)and\(\bar x_{Tr\left( {15.385} \right)}^M\)using the formula:
\({\bar x_{Tr}} = \frac{{\sum {{x_{Tr}}} }}{{{n_{Tr}}}}\)
Substitute the value of\({n_{Tr\left( {7.692} \right)}} = 11\)and\({n_{Tr\left( {15.385} \right)}} = 9\)in the above formula,
\(\begin{aligned}\bar x_{Tr\left( {7.692} \right)}^M &= \frac{{\sum {{x_{Tr\left( {7.692} \right)}}} }}{{{n_{Tr\left( {7.692} \right)}}}}\\ &= \frac{{\left( {3.4 + 3.4 + \ldots + 3.9 + 4.0} \right)}}{{11}}\\ &= \frac{{40.2}}{{11}}\\ &= 3.65\end{aligned}\)
\(\begin{aligned}\bar x_{Tr\left( {15.385} \right)}^M &= \frac{{\sum {{x_{Tr\left( {15.385} \right)}}} }}{{{n_{Tr\left( {15.385} \right)}}}}\\ &= \frac{{\left( {3.4 + 3.4 + \ldots + 3.8 + 3.9} \right)}}{9}\\ &= \frac{{32.8}}{9}\\ &= 3.64\end{aligned}\)
Compute \(\bar x_{Tr\left( {10} \right)}^M\) by interpolation method:
\(\bar x_{Tr\left( {10} \right)}^M = 0.7\bar x_{Tr\left( {7.692} \right)}^M + 0.3\bar x_{Tr\left( {15.385} \right)}^M\)
Substitute the values of\(\bar x_{Tr\left( {7.692} \right)}^M = 3.65\)and\(\bar x_{Tr\left( {15.385} \right)}^M = 3.64\) in the above formula to obtain the required trimmed mean for male group.
\(\begin{aligned}\bar x_{Tr\left( {10} \right)}^M &= 0.7\left( {3.65} \right) + 0.3\left( {3.64} \right)\\ &= 2.555 + 1.092\\ &= 3.647\end{aligned}\)
Thus, the 10% trimmed mean for Male group is 3.647
Compute 10% trimmed mean for Female group
Let \(\bar x_{Tr\left( {10} \right)}^F\)be the required trimmed mean. The trimmed value is calculated by multiplying the sample size and given trimming percentage i.e. 10%.
\(10\left( {0.10} \right) = 1\)
Therefore, the trimmed value is 1. Ignore one observation on both sides and calculate the mean of remaining data.
The remaining data are as follows:
F | 3.0 | 3.0 | 3.1 | 3.1 | 3.2 | 3.2 | 3.5 | 3.8 |
Compute the required trimmed mean by using the formula:
\(\bar x_{Tr\left( {10} \right)}^F = \frac{{\sum {{x_{Tr}}} }}{{{n_{Tr}}}}\)
Substitute the value of\({n_{Tr}} = 8\)in the above formula,
\(\begin{aligned}{{\bar x}_{Tr\left( {10} \right)}} &= \frac{{\left( {3 + 3 + \ldots + 3.5 + 3.5} \right)}}{8}\\ &= \frac{{25.9}}{8}\\ &= 3.237\end{aligned}\)
Thus, the 10% trimmed mean for Female group is 3.237.

Over 30 million students worldwide already upgrade their learning with 魅影直播!

