Explanations
  Textbooks
  Flashcards
  魅影直播 AI
  Notes
Notes  Study Plans
  Study Sets
  Find a degree
  Magazine
 Chapter 1: Q54E (page 46)
Grip is applied to produce normal surface forces that compress the object being gripped. Examples include two people shaking hands, or a nurse squeezing a patient鈥檚 forearm to stop bleeding. The article 鈥淚nvestigation of Grip Force, Normal Force, Contact Area, Hand Size, and Handle Size for Cylindrical Handles鈥� (Human Factors, 2008: 734鈥�744) included the following data on grip strength (N) for a sample of 42
individuals:
16 18 18 26 33 41 54 56 66 68 87 91 95
98 106 109 111 118 127 127 135 145 147 149 151 168
172 183 189 190 200 210 220 229 230 233 238 244 259
294 329 403
a. Construct a stem-and-leaf display based on repeating each stem value twice, and comment on interesting features.
b. Determine the values of the fourths and the fourth spread.
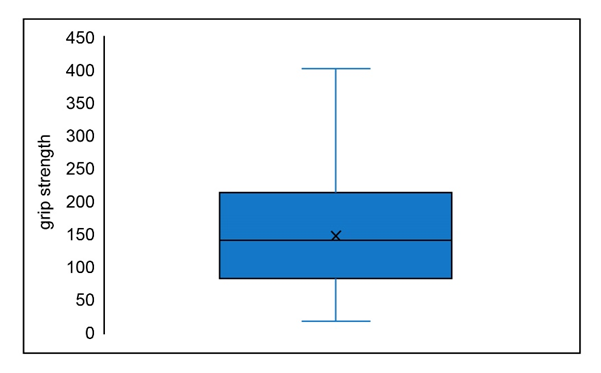
c. Construct a boxplot based on the five-number summary, and comment on its features.
d. How large or small does an observation have to be to qualify as an outlier? An extreme outlier? Are there any outliers?
e. By how much could the observation 403, currently the largest, be decreased without affecting\({f_s}\)?
Short Answer
a.
The stem and leaf plot is represented as,
Stem | Leaves |
0L | 16 18 18 26 33 41 |
0H | 54 56 66 68 87 91 95 98 |
1L | 06 09 11 18 27 27 35 45 47 49 |
1H | 51 68 72 83 89 90 |
2L | 00 10 20 29 30 33 38 44 |
2H | 59 94 |
3L | 29 |
3H | |
4L | 3 |
b.
The lower fourth is 87.
The upper fourth is 210.
The fourth spread is 123.
c. The boxplot is represented as:
d.
Yes, there is a mild outlier.
e. The amount by which 403 can be decreased without affecting the fourth spread is 210.
Step by step solution
Given information
The data on grip strength for a sample of 42 individuals is provided.
Construction a stem-and-leaf display and comment on its features
A comparative boxplot is a way to check the similarities and differences between two or more datasets.
a.
A stem-and-leaf display provides a visual representation of the dataset.
The steps to construct a stem-and-leaf display are as follows,
1) Select the leading digit for the stem and trailing digits for the leaves.
2) Represent the stem digits vertically and similarly the trailing digits corresponding to the stem digits.
3) Mention the units for the display.
The stem and leaf display for the provided scenario is,
Stem | Leaves |
0L | 16 18 18 26 33 41 |
0H | 54 56 66 68 87 91 95 98 |
1L | 06 09 11 18 27 27 35 45 47 49 |
1H | 51 68 72 83 89 90 |
2L | 00 10 20 29 30 33 38 44 |
2H | 59 94 |
3L | 29 |
3H | |
4L | 3 |
Units: 0H|54=54 and 2L|10=210
The features that can be observed from the above display are,
1) The distribution is positively skewed.
2) There is one outlier; that is, 403.
Computing the fourths and fourth spread
b.
The size of the sample is 42(even).
The fourth spread is computed as,
\({f_s} = {\rm{Upper}}\,{\rm{fourth}} - {\rm{Lower}}\;{\rm{fourth}}\)
where the upper fourth is the median value of the largest half and the lower fourth is the median value of the smallest half.
The data is already arranged in ascending order.
\(\begin{aligned}{n_{smallest}} &= 21\\{n_{{\rm{largest}}}} &= 21\end{aligned}\)
The lower fourth is computed as,
\(\begin{aligned}{}\frac{{{n_{smallest}} + 1}}{2} &= \frac{{21 + 1}}{2}\\ &= {11^{th}}value\end{aligned}\)
The 11th value of the smallest half is 87.
This implies that the lower fourth is 87.
The upper fourth is computed as,
\(\begin{aligned}\frac{{{n_{{\rm{largest}}}} + 1}}{2} &= \frac{{21 + 1}}{2}\\ &= {11^{th}}value\end{aligned}\)
The 11th value of the largest half is 210.
This implies that the upper fourth is 210.
The fourth spread is computed as,
\(\begin{aligned}{f_s} &= {\rm{Upper}}\,{\rm{fourth}} - {\rm{Lower}}\;{\rm{fourth}}\\ &= 210 - 87\\ &= 123\end{aligned}\)
Therefore, the fourth spread is 123.
Construction a boxplot and comment on its features
Referring to part b,
The five-number summary is,
The lower fourth is 87.
The upper fourth is 210.
The fourth spread is 123.
The smallest observation is 16.
The largest observation is 403.
For the even number of observations, the median value is computed as,
\(\begin{aligned}\tilde x &= average\;of\;{\left( {\frac{n}{2}} \right)^{th}}and\;{\left( {\frac{n}{2} + 1} \right)^{th}}\;ordered\;values\\ &= average\;of\;{\left( {\frac{{42}}{2}} \right)^{th}}and\;{\left( {\frac{{42}}{2} + 1} \right)^{th}}\;ordered\;values\\ &= average\;of\;{\left( {21} \right)^{th}}and\;{\left( {22} \right)^{th}}\;ordered\;values\\ &= \frac{{135 + 145}}{2}\\ &= 140\end{aligned}\)
Thus, the median value is 140.
The steps to construct a boxplot are as follows,
1) Compute the values of the five-number summary (smallest value, lower fourth, median, upper fourth, largest value).
2) Construct a line segment from the smallest value to the largest value of the dataset.
3) Construct a rectangular box from the lower fourth to the upper fourth and draw a line in the box at the median value.
The boxplot is represented as,
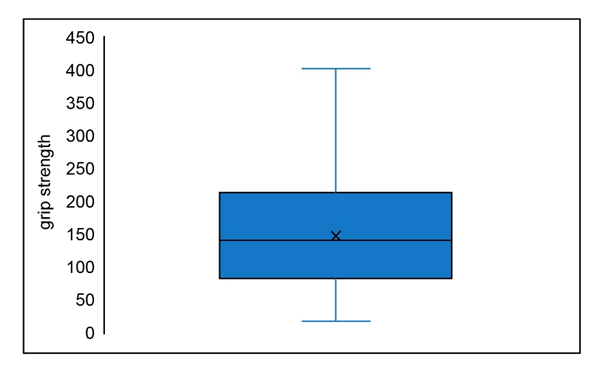
From the above-represented boxplot, it can be observed that the distribution is approximately symmetric. There are no outliers present in the data.
Checking the outliers
Any observation farther than 1.5\({f_s}\)from the closest fourth is referred as an outlier.
An outlier is extreme if it is more than 3\({f_s}\)from the nearest fourth, otherwise its mild.
Referring to the stem plot in part (a), it can be observed that there is an outlier; that is 403.
Checking if the outlier is mild or extreme.
\(\begin{aligned}403 &= 210 + 1.5{f_s}\\ &= 210 + \left( {1.5 * 123} \right)\\ &= 394.5\end{aligned}\)
Thus, the outlier present is mild.
Computing the amount by which 403 can be decreased without affecting
\({f_s}\)
The amount by which 403 can be decreased without affecting the fourth spread is 210

Over 30 million students worldwide already upgrade their learning with 魅影直播!