/*! This file is auto-generated */ .wp-block-button__link{color:#fff;background-color:#32373c;border-radius:9999px;box-shadow:none;text-decoration:none;padding:calc(.667em + 2px) calc(1.333em + 2px);font-size:1.125em}.wp-block-file__button{background:#32373c;color:#fff;text-decoration:none} Q32E Fire load (MJ/m2) is the heat en... [FREE SOLUTION] | 魅影直播

魅影直播

Fire load (MJ/m2) is the heat energy that could bereleased per square meter of floor area by combustionof contents and the structure itself. The article 鈥淔ireLoads in Office Buildings鈥 (J. of Structural Engr.,

1997: 365鈥368) gave the following cumulative percentages(read from a graph) for fire loads in a sample of388 rooms:

Value0 150 300 450 600

Cumulative %0 19.3 37.6 62.7 77.5

Value750 900 1050 1200 1350

Cumulative %87.2 93.8 95.7 98.6 99.1

Value1500 1650 1800 1950

Cumulative %99.5 99.6 99.8 100.0

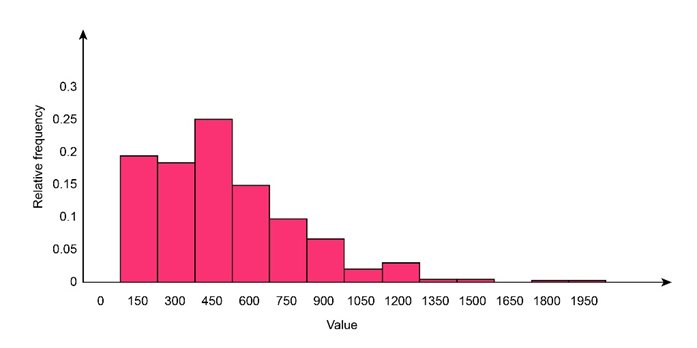
a. Construct a relative frequency histogram and commenton interesting features.

b. What proportion of fire loads are less than 600? At least 1200?

c. What proportion of the loads are between 600 and1200?

Short Answer

Expert verified

a.

b.

The proportion of fire loads are less than 600 is 0.627.

The proportion of fire loads that are at least 1200 is 0.043.

c.

The proportion of fire loads are between 600 and 1200 is 0.182.

Step by step solution

01

Given information

The cumulative percentages for different values are provided.

02

Construct a histogram and comment

a.

The cumulative percentage data is provided.

The table for relative frequency is represented as,

Value

Cumulative %

Relative percentage

Relative frequency

0

0

0

0

150

19.3

19.3

0.193

300

37.6

18.3

0.183

450

62.7

25.1

0.251

600

77.5

14.8

0.148

750

87.2

9.7

0.097

900

93.8

6.6

0.066

1050

95.7

1.9

0.019

1200

98.6

2.9

0.029

1350

99.1

0.5

0.005

1500

99.5

0.4

0.004

1650

99.6

0.1

0.001

1800

99.8

0.2

0.002

1950

100

0.2

0.002

Steps to construct a histogram are,

1) Determine the frequency or the relative frequency.

2) Mark the class boundaries on the horizontal axis.

3) Draw a rectangle on the horizontal axis corresponding to the frequency or relative frequency.

The histogram is represented as,
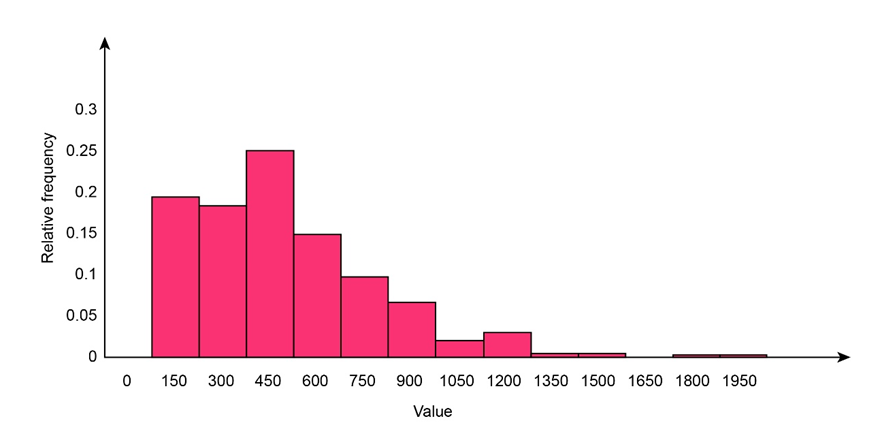
The features of the above-represented histogram are,

1)The histogram is unimodal. The value of mode is 450.

2)There are two outliers; 1800 and 1950.

3)The distribution is positively skewed.

03

Given information

The cumulative percentages for different values are provided.

04

Compute the proportion

Referring to the relative frequencies computed in part a,

b.

Let x represents the fire loads.

The proportion of fire loads are less than 600 is computed as,

\(\begin{aligned}P\left( {x < 600} \right) &= P\left( {x = 0} \right) + P\left( {x = 150} \right) + ... + P\left( {x = 450} \right)\\ &= 0 + 0.193 + ... + 0.251\\ &= 0.627\end{aligned}\)

Therefore, the proportion of fire loads are less than 600 is 0.627.

The proportion of fire loads that are at least 1200 is computed as,

\(\begin{aligned}P\left( {x \ge 1200} \right) &= P\left( {x = 1200} \right) + P\left( {x = 1350} \right) + ... + P\left( {x = 1950} \right)\\ &= 0.029 + 0.005 + ... + 0.002\\ &= 0.043\end{aligned}\)

Therefore, the proportion of fire loads that are at least 1200 is 0.043.

05

Given information

The cumulative percentages for different values are provided.

06

Compute the proportion

Let x represents the fire loads.

The proportion of fire loads are between 600and 1200 is computed as,

\(\begin{aligned}P\left( {600 < x < 1200} \right) &= P\left( {x = 750} \right) + P\left( {x = 900} \right) + P\left( {x = 1050} \right)\\ &= 0.097 + 0.066 + 0.019\\ &= 0.182\end{aligned}\)

Therefore, the proportion of fire loads are between 600and 1200 is 0.182.

Unlock Step-by-Step Solutions & Ace Your Exams!

  • Full Textbook Solutions

    Get detailed explanations and key concepts

  • Unlimited Al creation

    Al flashcards, explanations, exams and more...

  • Ads-free access

    To over 500 millions flashcards

  • Money-back guarantee

    We refund you if you fail your exam.

Over 30 million students worldwide already upgrade their learning with 魅影直播!

One App. One Place for Learning.

All the tools & learning materials you need for study success - in one app.

Get started for free

Most popular questions from this chapter

Exposure to microbial products, especially endotoxin, may have an impact on vulnerability to allergic diseases. The article 鈥淒ust Sampling Methods for Endotoxin鈥擜n Essential, But Underestimated Issue鈥 (Indoor Air,2006: 20鈥27) considered various issues associated with determining endotoxin concentration. The following data on concentration (EU/mg) in settled dust for one sample of urban homes and another of farm homes was kindly supplied by the authors of the cited article.

U: 6.0 5.0 11.0 33.0 4.0 5.0 80.0 18.0 35.0 17.0 23.0

F: 4.0 14.0 11.0 9.0 9.0 8.0 4.0 20.0 5.0 8.9 21.0

9.2 3.0 2.0 0.3

  1. Determine the sample mean for each sample. How do they compare?
  2. Determine the sample median for each sample. How do they compare? Why is the median for the urban sample so different from the mean for that sample?
  3. Calculate the trimmed mean for each sample by deleting the smallest and largest observation. What are the corresponding trimming percentages? How do the values of these trimmed means compare to the corresponding means and medians?

Poly(3-hydroxybutyrate) (PHB), a semicrystallinepolymer that is fully biodegradable and biocompatible,is obtained from renewable resources. From a sustainabilityperspective, PHB offers many attractive propertiesthough it is more expensive to produce than standardplastics. The accompanying data on melting point(掳C) for each of 12 specimens of the polymer using adifferential scanning calorimeter appeared in the article鈥淭he Melting Behaviour of Poly(3-Hydroxybutyrate)by DSC. Reproducibility Study鈥 (Polymer Testing,2013: 215鈥220).

180.5 181.7 180.9 181.6 182.6 181.6

181.3 182.1 182.1 180.3 181.7 180.5

Compute the following:

  1. The sample range
  2. The sample variance \({{\bf{s}}^{\bf{2}}}\)from the definition (Hint:First subtract 180 from each observation.
  3. The sample standard deviation
  4. \({{\bf{s}}^{\bf{2}}}\)using the shortcut method

A deficiency of the trace element selenium in the diet can negatively impact growth, immunity, muscle and neuromuscular function, and fertility. The introduction of selenium supplements to dairy cows is justified when pastures have low selenium levels. Authors of the article 鈥淓ffects of Short Term Supplementation with Selenised Yeast on Milk Production and Composition of Lactating Cows鈥 (Australian J. of Dairy Tech., 2004: 199鈥203) supplied the following data on milk selenium concentration (mg/L) for a sample of cows given a selenium supplement and a control sample given no supplement, both initially and after a 9-day period.

Obs

InitSe

InitCont

FinalSe

FinalCont

1

11.4

9.1

138.3

9.3

2

9.6

8.7

104.0

8.8

3

10.1

9.7

96.4

8.8

4

8.5

10.8

89.0

10.1

5

10.3

10.9

88.0

9.6

6

10.6

10.6

103.8

8.6

7

11.8

10.1

147.3

10.4

8

9.8

12.3

97.1

12.4

9

10.9

8.8

172.6

9.3

10

10.3

10.4

146.3

9.5

11

10.2

10.9

99.0

8.4

12

11.4

10.4

122.3

8.7

13

9.2

11.6

103.0

12.5

14

10.6

10.9

117.8

9.1

15

10.8

121.5

16

8.2

93.0

a. Do the initial Se concentrations for the supplementand control samples appear to be similar? Use various techniques from this chapter to summarize thedata and answer the question posed.
b. Again use methods from this chapter to summarizethe data and then describe how the final Se concentration values in the treatment group differ fromthose in the control group.

A trial has just resulted in a hung jury because eight members of the jury were in favour of a guilty verdict and the other four were for acquittal. If the jurors leave the jury room in random order and each of the first four leaving the room is accosted by a reporter in quest of an interview, what is the\({\rm{pmf}}\)of\({\rm{X = }}\)the number of jurors favouring acquittal among those interviewed? How many of those favouring acquittal do you expect to be interviewed?

Every corporation has a governing board of directors. The number of individuals on a board varies from one corporation to another. One of the authors of the article 鈥淒oes Optimal Corporate Board Size Exist? An Empirical Analysis鈥 (J. of Applied Finance, 2010: 57鈥69) provided the accompanying data on the number of directors on each board in a random sample of 204 corporations.

No. directors: 4 5 6 7 8 9

Frequency: 3 12 13 25 24 42

No. directors: 10 11 12 13 14 15

Frequency: 23 19 16 11 5 4

No. directors: 16 17 21 24 32

Frequency: 1 3 1 1 1

a. Construct a histogram of the data based on relative frequencies and comment on any interesting features.

b. Construct a frequency distribution in which the last row includes all boards with at least 18 directors. If this distribution had appeared in the cited article, would you be able to draw a histogram? Explain.

c. What proportion of these corporations have at most 10 directors?

d. What proportion of these corporations have more than 15 directors?

See all solutions

Recommended explanations on Math Textbooks

View all explanations

What do you think about this solution?

We value your feedback to improve our textbook solutions.

Study anywhere. Anytime. Across all devices.