
 Explanations
  Textbooks
  Flashcards
  魅影直播 AI
  Notes
Notes  Study Plans
  Study Sets
  Find a degree
  Magazine
 Chapter 1: Q17E (page 25)
The accompanying data came from a study of collusion inbidding within the construction industry (鈥淒etection ofCollusive Behavior,鈥� J. of Construction Engr. AndMgmnt, 2012: 1251鈥�1258).
No.Bidders | No.Contracts |
2 | 7 |
3 | 20 |
4 | 26 |
5 | 16 |
6 | 11 |
7 | 9 |
8 | 6 |
9 | 8 |
10 | 3 |
11 | 2 |
a. What proportion of the contracts involved at mostfive bidders? At least five bidders?
b. What proportion of the contracts involved betweenfive and 10 bidders, inclusive? Strictly between fiveand 10 bidders?
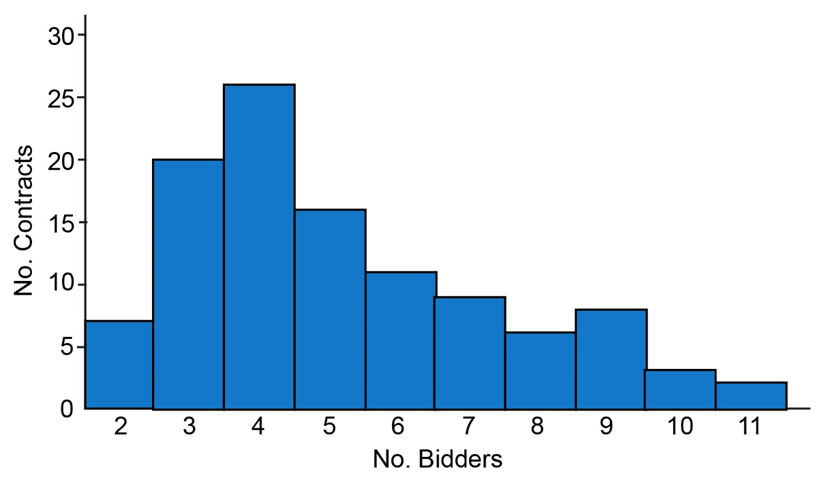
c. Construct a histogram and comment on interestingfeatures.
Short Answer
a.
The proportion of the contracts involved at most five bidders is 0.64.
The proportion of the contracts involved at least five bidders is 0.51.
b.
The proportion of the contracts between 5 and 10 bidders, inclusively is 0.49.
The proportion of the contracts strictly between 5 and 10 bidders is 0.31.
c.
Step by step solution
Given information
Thedatafrom a study of collusion in bidding within the construction industry is provided.
a.
The total number of contracts is 108.
Let X represents the number of Bidders.
Compute the proportion
The proportion of the contracts involved at most five bidders is computed as,
\(\begin{aligned}P\left( {X \le 5} \right) &= P\left( {X = 2} \right) + P\left( {X = 3} \right) + P\left( {X = 4} \right) + P\left( {X = 5} \right)\\ &= \frac{{n\left( {X = 2} \right) + n\left( {X = 3} \right) + n\left( {X = 4} \right) + n\left( {X = 5} \right)}}{N}\\ &= \frac{{7 + 20 + 26 + 16}}{{108}}\\ &= 0.638\\ &\approx 0.64\end{aligned}\)
Therefore, the proportion of the contracts involved at most five bidders is 0.64.
The proportion of the contracts involved at least five bidders is computed as,
\(\begin{aligned}P\left( {X \ge 5} \right) &= 1 - P\left( {X < 5} \right)\\ &= 1 - \left( {P\left( {X = 2} \right) + P\left( {X = 3} \right) + P\left( {X = 4} \right)} \right)\\ &= 1 - \left( {\frac{{n\left( {X = 2} \right) + n\left( {X = 3} \right) + n\left( {X = 4} \right)}}{N}} \right)\\ &= 1 - \frac{{7 + 20 + 26}}{{108}}\\ &= 1 - 0.49\\ &= 0.51\end{aligned}\)
Therefore, the proportion of the contracts involved at least five bidders is 0.51.
Given information
The datafrom a study of collusion in bidding within the construction industry is provided.
Compute the proportion
b.
The total number of contracts is 108.
Let X represents the number of Bidders.
The proportion of the contracts involved between 5 and 10 bidders, inclusively is computed as,
\(\begin{aligned}P\left( {5 \le X \le 10} \right) &= P\left( {X = 5} \right) + P\left( {X = 6} \right) + P\left( {X = 7} \right) + P\left( {X = 8} \right) + P\left( {X = 9} \right) + P\left( {X = 10} \right)\\ &= \frac{{n\left( {X = 5} \right) + n\left( {X = 6} \right) + n\left( {X = 7} \right)... + n\left( {X = 10} \right)}}{N}\\ &= \frac{{16 + 11 + 9 + 6 + 8 + 3}}{{108}}\\ &= 0.49\end{aligned}\)
Therefore, the proportion of the contracts between 5 and 10 bidders, inclusively is 0.49.
The proportion of the contracts involved strictly between 5 and 10 bidders is computed as,
\(\begin{aligned}P\left( {5 < X < 10} \right) &= P\left( {X = 6} \right) + P\left( {X = 7} \right) + P\left( {X = 8} \right) + P\left( {X = 9} \right)\\ &= \frac{{n\left( {X = 6} \right) + n\left( {X = 7} \right) + n\left( {X = 8} \right) + n\left( {X = 9} \right)}}{N}\\ &= \frac{{11 + 9 + 6 + 8}}{{108}}\\ &= 0.31\end{aligned}\)
Therefore, the proportion of the contracts strictly between 5 and 10 bidders is 0.31.
Given information
The datafrom a study of collusion in bidding within the construction industry is provided.
Construct a histogram and state the features
c.
Steps to construct a histogram are,
1) Determine the frequency or the relative frequency.
2) Mark the class boundaries on the horizontal axis.
3) Draw a rectangle on the horizontal axis corresponding to the frequency or relative frequency.
The histogram is represented as,
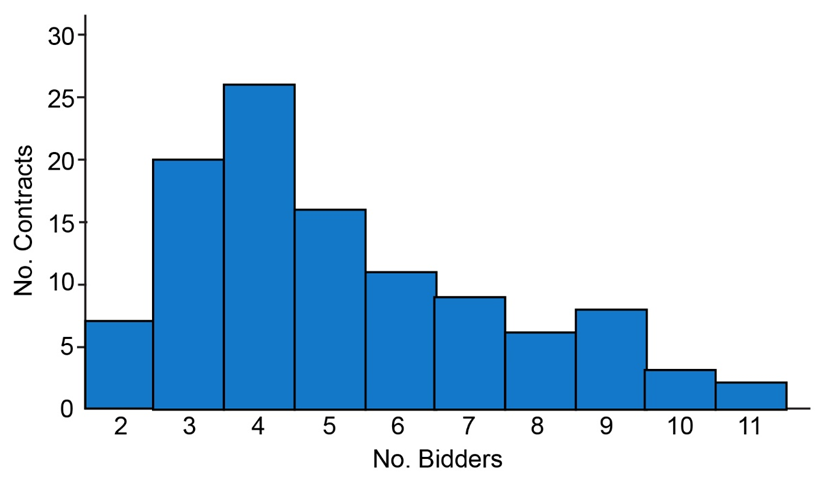
The features that can be observed from the above histogram are,
1)The histogram is unimodal; this implies that there is only one mode; that is 4.
2)The distribution is positively skewed.
3)The typical value of x is 5.
4) There are no outliers present in the data.

Over 30 million students worldwide already upgrade their learning with 魅影直播!

