/*! This file is auto-generated */ .wp-block-button__link{color:#fff;background-color:#32373c;border-radius:9999px;box-shadow:none;text-decoration:none;padding:calc(.667em + 2px) calc(1.333em + 2px);font-size:1.125em}.wp-block-file__button{background:#32373c;color:#fff;text-decoration:none} Q9 E the article 鈥樷檈valuation of ... [FREE SOLUTION] | 魅影直播

魅影直播

the article 鈥樷檈valuation of a ventilation strategy to prevent barotrauma in patients at high risk for Acute Respiratory Distress Syndrome鈥 (New Engl. J. of Med., \(1998:355 - 358)\) reported on an experiment in which \(120\) patients with similar clinical features were randomly divided into a control group and a treatment group, each consisting of \(60\) patients. The sample mean ICU stay (days) and sample standard deviation for the treatment group were \(19.9\) and\(39.1\), respectively, whereas these values for the control group were \(13.7\) and \(15.8\).

a) Calculate a point estimate for the difference between true average ICU stay for the treatment and control groups. Does this estimate suggest that there is a significant difference between true average stays under the two conditions?

b) Answer the question posed in part (a) by carrying out a formal test of hypotheses. Is the result different from what you conjectured in part (a)?

c)Does it appear that ICU stay for patients given the ventilation treatment is normally distributed? Explain your reasoning9. The article 鈥淓valuation of a Ventilation Strategy to Prevent Barotrauma in Patients at High Risk for

d)Estimate true average length of stay for patients given the ventilation treatment in a way that conveys information about precision and reliability

Short Answer

Expert verified

the solution is

a)\(6.2\)

b) do not reject null hypothesis (at any reasonable confidence level)

c)no

d) \((10,21.9).\)

Step by step solution

01

calculate the point estimate for the difference between true average

given

\(\begin{array}{*{20}{l}}{\bar x = 19.9;}&{m = 60;}&{{s_1} = 39.1}\\{\bar y = 13.7;}&{n = 60;}&{{s_2} = 15.8.}\end{array}\)

(a)

The difference in true average between the groups has a point estimate of

\(\bar x - \bar y = 19.9 - 13.7 = 6.2\)

This point estimate suggests that the true averages of the two groups may differ.

02

find statistically significant difference

the normal test would be testing hypotheses \({H_0}:{\mu _1} - {\mu _2} = 0\) versus \({H_a}:{\mu _1} - {\mu _2} \ne 0\)

when the null hypothesis is

\({H_0}:{\mu _1} - {\mu _2} = {\Delta _0}\)

The test statistic value

\(z = \frac{{(\bar x - \bar y) - {\Delta _0}}}{{\sqrt {\frac{{s_1^2}}{m} + \frac{{s_2^2}}{n}} }}\)

The \(P\) value is derived for the acceptable alternative hypothesis by calculating the adequate area under the standard normal curve. When both \(m > 40,n > 40\), this test can be employed.

This approach can be used because both \(m,n > 40\). The value of \(z\) is.

\(z = \frac{{19.9 - 13.7}}{{\sqrt {39.{1^2}/60 + 15.{8^2}.60} }} = \frac{{6.2}}{{5.44}} = 1.14\)

The \(P\) value can be calculated as two times the area under the standard normal curve to the right of \(\left| z \right|\) because the alternative hypothesis is two-sided. The \(P\) value can be calculated using the table in the appendix or software.

\(P = 2 \times P(Z > 1.14) = 2 \times 0.1271 = 0.2542.\)

Since

\(P = 0.2542 > \alpha \)

For any reasonable \(\alpha \)

Do not reject null hypothesis

There is no statistically significant difference.

03

explain reason

c)

The length of time that patients spend in the ICU does not appear to be distributed evenly. The two standard deviations from the mean make the normal distribution symmetric.

\(19.9 + 2 \times 39.1 = 98.1\)

and the data is all greater than \(0\) (days), with the majority of the data falling between \(0\) and \(98.1\), indicating a positively skewed distribution (not symmetric).

04

confidence interval

d)

The normalized random variable for big \(n\).

\(Z = \frac{{\bar X - \mu }}{{S/\sqrt n }}\)

has a normal distribution with a standard deviation of \(1\) and an expectation of \(0\). As a result, a

large-sample confidence interval for \(\mu \)

\(\bar x \pm {z_{\alpha /2}} \times \frac{s}{{\sqrt n }}\)

with a degree of confidence of around \(100(1 - \alpha )\% \) Regardless of population distribution, this is true.

Because \(n = 60\) is a sufficiently big number, this confidence interval might be used to estimate the genuine average length of stay. For genuine average, the large-sample confidence interval is

\(\begin{array}{l}\left( {\bar x - {z_{\alpha /2}} \times \frac{s}{{\sqrt n }},\bar x + {z_{\alpha /2}} \times \frac{s}{{\sqrt n }}} \right) = \left( {19.9 - 1.96 \times \frac{{39.1}}{{\sqrt {60} }},19.9 + 1.96 \times \frac{{39.1}}{{\sqrt {60} }}} \right)\\ = (10,21.9).\end{array}\)

The confidence level chosen here is

\(\alpha = 0.05\) and \({z_{\alpha /2}} = {z_{0.025}} = 1.96.\)

05

conclusion

a)\(6.2\)

b) do not reject null hypothesis (at any reasonable confidence level)

c)no

d) \((10,21.9).\)

Unlock Step-by-Step Solutions & Ace Your Exams!

  • Full Textbook Solutions

    Get detailed explanations and key concepts

  • Unlimited Al creation

    Al flashcards, explanations, exams and more...

  • Ads-free access

    To over 500 millions flashcards

  • Money-back guarantee

    We refund you if you fail your exam.

Over 30 million students worldwide already upgrade their learning with 魅影直播!

One App. One Place for Learning.

All the tools & learning materials you need for study success - in one app.

Get started for free

Most popular questions from this chapter

Is there any systematic tendency for part-time college faculty to hold their students to different standards than do full-time faculty? The article 鈥淎re There Instructional Differences Between Full-Time and Part-Time Faculty?鈥 (College Teaching, \(2009: 23 - 26)\) reported that for a sample of \(125 \) courses taught by fulltime faculty, the mean course \(GPA\) was \(2.7186\) and the standard deviation was \(.63342\), whereas for a sample of \(88\) courses taught by part-timers, the mean and standard deviation were \(2.8639\) and \(.49241,\) respectively. Does it appear that true average course \(GPA\) for part-time faculty differs from that for faculty teaching full-time? Test the appropriate hypotheses at significance level \( .01\).

Teen Court is a juvenile diversion program designed to circumvent the formal processing of first-time juvenile offenders within the juvenile justice system. The article "An Experimental Evaluation of Teen Courts" (J. of Experimental Criminology, 2008: 137-163) reported on a study in which offenders were randomly assigned either to Teen Court or to the traditional Department of Juvenile Services method of processing. Of the \(56TC\) individuals, 18 subsequently recidivated (look it up!) during the 18 -month follow-up period, whereas 12 of the 51 DJS individuals did so. Does the data suggest that the true proportion of TC individuals who recidivate during the specified follow-up period differs from the proportion of DJS individuals who do so? State and test the relevant hypotheses using a significance level of 0.10.

Damage to grapes from bird predation is a serious problem for grape growers. The article "'Experimental Method to Investigate and Monitor Bird Behavior and Damage to Vineyards" (Amer. \(J\). of Enology and Viticulture, 2004: 288-291) reported on an experiment involving a bird-feeder table, time-lapse video, and artificial foods. Information was collected for two different bird species at both the experimental location and at a natural vineyard setting. Consider the following data on time (sec) spent on a single visit to the location.

\(\begin{array}{l}Species Location n \overline x SEmean\\Blackbirds Exptl 65 13.4 2.05 \\Blackbirds Natural 50 9.7 1.76\\Silvereyes Exptl 34 49.4 4.78\\Silvereyes Natural 46 38.4 5.06\end{array}\)

a. Calculate an upper confidence bound for the true average time that blackbirds spend on a single visit at the experimental location.

b. Does it appear that true average time spent by blackbirds at the experimental location exceeds the true average time birds of this type spend at the natural location? Carry out a test of appropriate hypotheses.

c. Estimate the difference between the true average time blackbirds spend at the natural location and true average time that silvereyes spend at the natural

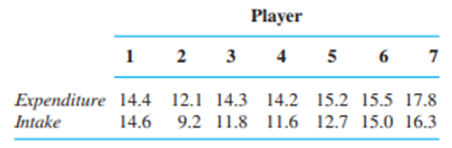
How does energy intake compare to energy expenditure? One aspect of this issue was considered in the article 鈥淢easurement of Total Energy Expenditure by the Doubly Labelled Water Method in Professional Soccer Players鈥 (J. of Sports Sciences, 2002: 391鈥397), which contained the accompanying data (MJ/day).

Test to see whether there is a significant difference between intake and expenditure. Does the conclusion depend on whether a significance level of .05, .01, or .001 is used?

The article "Effect of Internal Gas Pressure on the Compression Strength of Beverage Cans and Plastic Bottles" (J. of Testing and Evaluation, \(1993: 129 - 131\)) includes the accompanying data on compression strength (lb) for a sample of\(12 - oz\)aluminum cans filled with strawberry drink and another sample filled with cola. Does the data suggest that the extra carbonation of cola results in a higher average compression strength? Base your answer on a\(P\)-value. What assumptions are necessary for your analysis?

\(\begin{array}{l}BeverageSampleSizeSampleMeanSampleSD\\Strawberrydrink1554021\\Cola1555415\end{array}\)

See all solutions

Recommended explanations on Math Textbooks

View all explanations

What do you think about this solution?

We value your feedback to improve our textbook solutions.

Study anywhere. Anytime. Across all devices.