/*! This file is auto-generated */ .wp-block-button__link{color:#fff;background-color:#32373c;border-radius:9999px;box-shadow:none;text-decoration:none;padding:calc(.667em + 2px) calc(1.333em + 2px);font-size:1.125em}.wp-block-file__button{background:#32373c;color:#fff;text-decoration:none} Q. 85 Repeat the test in Exercise 10.8... [FREE SOLUTION] | ÷ÈÓ°Ö±²¥

÷ÈÓ°Ö±²¥

Repeat the test in Exercise 10.83, but this time combine the data from Laps 1 and 5.

Short Answer

Expert verified

(a) The null hypothesis:H0:μ1=μ2
(b) The alternate hypothesis: Ha:μ1≠μ2
(c) The difference between the mean times for completing a lap in races and in practices is denotes by X1¯-X2¯.
(d) Student's t distribution.
(e) The test statistic: -5.087.
(f) The p-value: 0.0000084
(g) Check student's solution.
(h) (i) α=0.05
(ii) Decision: Null hypothesis is rejected.
(iii) α>p-value
(iv) Conclusion: There is enough evidence to conclude that the mean time for completing a lap in races is different from that in practices, at the 5% significance level.

Step by step solution

01

Given information

To repeat the test in Exercise 10.83, but this time combine the data from Laps 1 and 5.

02

Explanation

(a) The null hypothesis is defined as follows:
H0:μ1=μ2
(b) The alternate hypothesis is defined as follows:
Ha:μ1≠μ2
(c) The difference between the mean times for completing a lap in races and in practices is denotes by X1¯-X2¯
(d) Student's t distribution.
(e) The paired test static for the mean difference is,
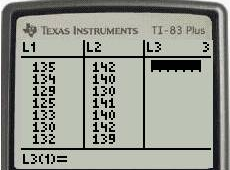
After ENTER all values the OUTPUT will look like this:
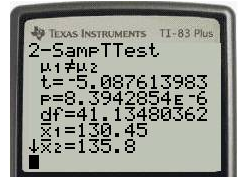
Hence, the test statistics -5.087.

03

Explanation

(f) The p-value from the output is 0.0000084.
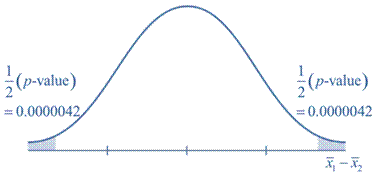
(g) Using the data from the last exercise, create a mental picture of the situation.
The horizontal axis should be clearly labelled and scaled, and the p-value-corresponding region(s) on the graph should be shaded.

(h)
(i) α=0.05
(ii) Decision: Null hypothesis is rejected.
(iii) α>p-value
(iv) Conclusion: There is enough evidence to conclude that the mean time for completing a lap in races is different from that in practices, at the 5%significance level.

Unlock Step-by-Step Solutions & Ace Your Exams!

  • Full Textbook Solutions

    Get detailed explanations and key concepts

  • Unlimited Al creation

    Al flashcards, explanations, exams and more...

  • Ads-free access

    To over 500 millions flashcards

  • Money-back guarantee

    We refund you if you fail your exam.

Over 30 million students worldwide already upgrade their learning with ÷ÈÓ°Ö±²¥!

One App. One Place for Learning.

All the tools & learning materials you need for study success - in one app.

Get started for free

Most popular questions from this chapter

Use the following information to answer the next twelve exercises. In the recent Census, three percent of the U.S. population reported being of two or more races. However, the percent varies tremendously from state to state. Suppose that two random surveys are conducted. In the first random survey, out of 1,000 North Dakotans, only nine people reported being of two or more races. In the second random survey, out of 500 Nevadans, 17 people reported being of two or more races. Conduct a hypothesis test to determine if the population percents are the same for the two states or if the percent for Nevada is statistically higher than for North Dakota.

Does it appear that the proportion of Nevadans who are two or more races is higher than the proportion of NorthDakotans? Why or why not?

Use the following information to answer the next five exercises. A researcher is testing the effects of plant food on plant growth. Nine plants have been given the plant food. Another nine plants have not been given the plant food. The heights of the plants are recorded after eight weeks. The populations have normal distributions. The following table is the result. The researcher thinks the food makes the plants grow taller.

At the 1 % significance level, what is your conclusion?

A student at a four-year college claims that mean enrollment at four–year colleges is higher than at two–year colleges in the United States. Two surveys are conducted. Of the \(35\) two–year colleges surveyed, the mean enrollment was \(5,068\) with a standard deviation of \(4,777\). Of the \(35\) four-year colleges surveyed, the mean enrollment was \(5,466\) with a standard deviation of \(8,191\).

It is believed that 70%of males pass their drivers test in the first attempt, while 65%of females pass the test in the first attempt. Of interest is whether the proportions are in fact equal.

Indicate if the hypothesis test is for :

a. independent group means, population standard deviations, and/or variances known

b. independent group means, population standard deviations, and/or variances unknown

c. matched or paired samples

d. single mean

e. two proportions

f. single proportion

Use the following information to answer the next three exercises: A study is done to determine which of two soft drinks has more sugar. There are 13 cans of Beverage A in a sample and six cans of Beverage B. The mean amount of sugar in Beverage A is 36 grams with a standard deviation of 0.6 grams. The mean amount of sugar in Beverage B is 38 grams with a standard deviation of 0.8 grams. The researchers believe that Beverage B has more sugar than Beverage A, on average. Both populations have normal distributions.

Are standard deviations known or unknown?

See all solutions

Recommended explanations on Math Textbooks

View all explanations

What do you think about this solution?

We value your feedback to improve our textbook solutions.

Study anywhere. Anytime. Across all devices.