/*! This file is auto-generated */ .wp-block-button__link{color:#fff;background-color:#32373c;border-radius:9999px;box-shadow:none;text-decoration:none;padding:calc(.667em + 2px) calc(1.333em + 2px);font-size:1.125em}.wp-block-file__button{background:#32373c;color:#fff;text-decoration:none} Q. 40 Use the following information to... [FREE SOLUTION] | ÷ÈÓ°Ö±²¥

÷ÈÓ°Ö±²¥

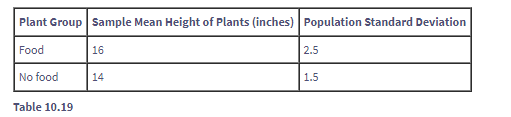
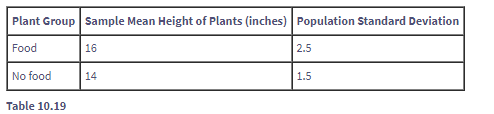
Use the following information to answer the next five exercises. A researcher is testing the effects of plant food on plant growth. Nine plants have been given the plant food. Another nine plants have not been given the plant food. The heights of the plants are recorded after eight weeks. The populations have normal distributions. The following table is the result. The researcher thinks the food makes the plants grow taller.
At the 1 % significance level, what is your conclusion?

Short Answer

Expert verified

From the sample data, there is insufficient evidence to conclude that plant food rises as plant height increases, rather than not feeding the plants.

Step by step solution

01

Given Information

The table is

Plant Group
Sample Mean Height of Plants (inches)
Population Standard Deviation
Food162.5
No food141.5
02

At the 1% significance level, what is your conclusion.

Since, a<p- value that is 0.01<0.0198

To not rule out the null hypothesis.

From the sample data, there is insufficient evidence to conclude that plant food rises as plant height increases, rather than not feeding the plants.

Unlock Step-by-Step Solutions & Ace Your Exams!

  • Full Textbook Solutions

    Get detailed explanations and key concepts

  • Unlimited Al creation

    Al flashcards, explanations, exams and more...

  • Ads-free access

    To over 500 millions flashcards

  • Money-back guarantee

    We refund you if you fail your exam.

Over 30 million students worldwide already upgrade their learning with ÷ÈÓ°Ö±²¥!

One App. One Place for Learning.

All the tools & learning materials you need for study success - in one app.

Get started for free

Most popular questions from this chapter

Conduct a hypothesis test to answer the next two exercises.
87. The exact distribution for the hypothesis test is:
a. the normal distribution
b. the Student's t-distribution
c. the uniform distribution
d. the exponential distribution

A golf instructor is interested in determining if her new technique for improving players’ golf scores is effective. She takes four (4) new students. She records their 18-hole scores before learning the technique and then after having taken her class. She conducts a hypothesis test. The data are as Table 10.37.

Player 1Player 2Player 3Player 4Mean score before class83789387Mean score after class80808686

This is:

a. a test of two independent means.

b. a test of two proportions.

c. a test of a single mean.

d. a test of a single proportion.

An experiment is conducted to show that blood pressure can be consciously reduced in people trained in a "biofeedback exercise program." Six subjects were randomly selected and blood pressure measurements were recorded before and after the training. The difference between blood pressures was calculated (after - before) producing the following results: x¯d=-10.2sd=8.4. Using the data, test the hypothesis that the blood pressure has decreased after the training.

The distribution for the test is:

a.t5

b.t6

c.N(-10.2,8.4)

d.N-10.2,8.46

Use the following information to answer the next five exercises. A researcher is testing the effects of plant food on plant growth. Nine plants have been given the plant food. Another nine plants have not been given the plant food. The heights of the plants are recorded after eight weeks. The populations have normal distributions. The following table is the result. The researcher thinks the food makes the plants grow taller.

Draw the graph of the p-value.

95. A group of transfer bound students wondered if they will spend the same mean amount on texts and supplies each year at their four-year university as they have at their community college. They conducted a random survey of 54 students at their community college and 66 students at their local four-year university. The sample means were \(947 and \)1,011, respectively. The population standard deviations are known to be \(254and \)87, respectively. Conduct a hypothesis test to determine if the means are statistically the same.

See all solutions

Recommended explanations on Math Textbooks

View all explanations

What do you think about this solution?

We value your feedback to improve our textbook solutions.

Study anywhere. Anytime. Across all devices.