/*! This file is auto-generated */ .wp-block-button__link{color:#fff;background-color:#32373c;border-radius:9999px;box-shadow:none;text-decoration:none;padding:calc(.667em + 2px) calc(1.333em + 2px);font-size:1.125em}.wp-block-file__button{background:#32373c;color:#fff;text-decoration:none} Q. 64 64. Three students, Linda, Tuan,... [FREE SOLUTION] | ÷ÈÓ°Ö±²¥

÷ÈÓ°Ö±²¥

64. Three students, Linda, Tuan, and Javier, are given five laboratory rats each for a nutritional experiment. Each rat's weight is recorded in grams. Linda feeds her rats Formula A, Tuan feeds his rats Formula B, and Javier feeds his rats Formula C. At the end of a specified time period, each rat is weighed again, and the net gain in grams is recorded. Using a significance level of 10%, test the hypothesis that the three formulas produce the same mean weight gain

Linda's rats
Tuan's rats
Javier's rats
43.5
47.0
51.2
39.4
40.5
40.9
41.3
38.9
37.9
46.0
46.3
45.0
38.2
44.2
48.6

Short Answer

Expert verified

There is insufficient evidence to conclude that the means are different. Hence, get the null hypothesis.

Step by step solution

01

Given information

Three students, Linda, Tuan, and Javier, are given five laboratory rats each for a nutritional experiment. Each rat's weight is recorded in grams. Linda feeds her rats Formula A, Tuan feeds his rats Formula B, and Javier feeds his rats Formula C.

02

Using Calculator

To get the results on the calculator:
Press STAT, then Press 1 EDIT. Put the data into the lists L1,L2,L3
Press STAT, and arrow over to TESTS, and arrow down to ANOVA. Press ENTER, and then enterL1,L2,L3. Press ENTER. The values in the foregoing ANOVA table arequickly produced by the calculator, including the test statistic and the p-value of the test.
The calculator shows :

F=0.66853555

p=0.530548

FACTOR

df=2

SS=23.212

MS=11.606

ERROR

df=12

SS=208.324

MS=17.36

03

Hypothesis test

The solution sheet to lead the hypothesis tests, and then:
The null hypothesis that three mean commuting mileages are the identical is:
H0:μl=μt=μj
The alternate hypothesis is that at least two of the means are dissimilar.
The degree of freedom in the numerator - df(num)is2,
and the degree of freedom in the denominator - df(denom)is 12

Use theF distribution for the test of three different means.
The value of the test statistic (F-value) is 0.668
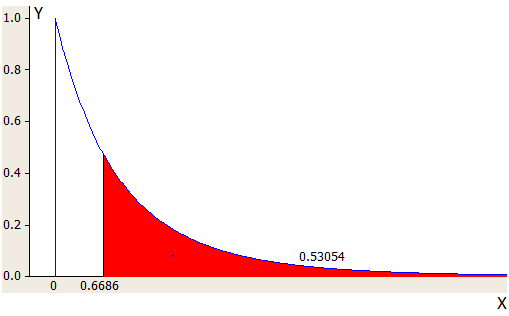
The P-value for the test is 0.5305

04

Graphical representation of the distribution

The graph of the distribution is,
05

Decision, Reason and explanation 

Level of significance αis 0.10
Decision: Do not reject the null hypothesis
Reason for decision: P-value is 0.53which is greater than the0.10 level of significance.
Conclusion: There is insufficient evidence to conclude that the means are different.

Unlock Step-by-Step Solutions & Ace Your Exams!

  • Full Textbook Solutions

    Get detailed explanations and key concepts

  • Unlimited Al creation

    Al flashcards, explanations, exams and more...

  • Ads-free access

    To over 500 millions flashcards

  • Money-back guarantee

    We refund you if you fail your exam.

Over 30 million students worldwide already upgrade their learning with ÷ÈÓ°Ö±²¥!

One App. One Place for Learning.

All the tools & learning materials you need for study success - in one app.

Get started for free

Most popular questions from this chapter

As part of an experiment to see how different types of soil cover would affect slicing tomato production, Marist College students grew tomato plants under different soil cover conditions. Groups of three plants each had one of the following treatments

• bare soil

• a commercial ground cover

• black plastic

• straw

• compost

All plants grew under the same conditions and were the same variety. Students recorded the weight (in grams) of tomatoes produced by each of the n=15plants:

Bare:n1=3Ground cover:n2=3Plastic:n3=3Straw:n4=3Compost:n5=3
2625
5348
6583
7285
6277
2997
5682
8560
6897
7818
4915
5482
3830
9230
8677

Create one-way ANOVA table

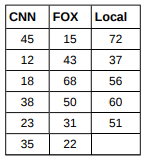
A researcher wants to know if the mean times (in minutes) that people watch their favorite news station are the same. Suppose that Table 13.24 shows the results of a study.

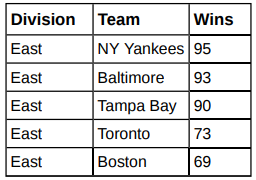
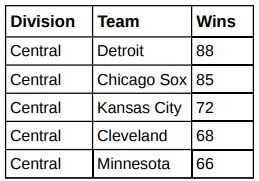
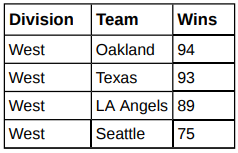
The American League and the National League of Major League Baseball are each divided into three divisions: East, Central, and West. Many years, fans talk about some divisions being stronger (having better teams) than other divisions. This may have consequences for the postseason. For instance, in 2012Tampa Bay won 90games and did not play in the postseason, while Detroit won only 88and did play in the postseason. This may have been an oddity, but is there good evidence that in the 2012season, the American League divisions were significantly different in overall records? Use the following data to test whether the mean number of wins per team in the three American League divisions were the same or not. Note that the data are not balanced, as two divisions had five teams, while one had only four

What happens to the curves as the degrees of freedom for the numerator and the denominator get larger?

Are the mean numbers of daily visitors to a ski resort the same for the three types of snow conditions? Suppose that Table 13.27 shows the results of a study.

Assume that all distributions are normal, the four population standard deviations are approximately the same, and the data were collected independently and randomly. Use a level of significance of 0.05.

See all solutions

Recommended explanations on Math Textbooks

View all explanations

What do you think about this solution?

We value your feedback to improve our textbook solutions.

Study anywhere. Anytime. Across all devices.