/*! This file is auto-generated */ .wp-block-button__link{color:#fff;background-color:#32373c;border-radius:9999px;box-shadow:none;text-decoration:none;padding:calc(.667em + 2px) calc(1.333em + 2px);font-size:1.125em}.wp-block-file__button{background:#32373c;color:#fff;text-decoration:none} Q.109 The Federal Election Commission ... [FREE SOLUTION] | ÷ÈÓ°Ö±²¥

÷ÈÓ°Ö±²¥

The Federal Election Commission (FEC) collects information about campaign contributions and disbursements for

candidates and political committees each election cycle. A political action committee (PAC) is a committee formed to raise

money for candidates and campaigns. A Leadership PAC is a PAC formed by a federal politician (senator or representative)

to raise money to help other candidates’ campaigns.

The FEC has reported financial information for 556Leadership PACs that operating during the 2011–2012election cycle.

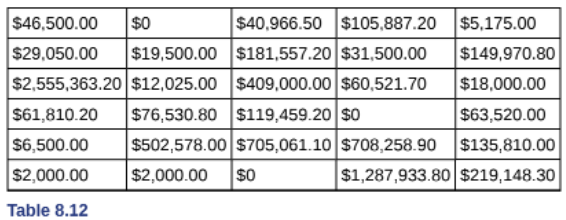
The following table shows the total receipts during this cycle for a random selection of 30Leadership PACs.

̄x=\(251,854.23

s=\)521,130.41

Use this sample data to construct a 96%confidence interval for the mean amount of money raised by all Leadership PACs

during the 2011–2012election cycle. Use the Student's t-distribution.

Short Answer

Expert verified

We estimate that the mean amount of money raised by all Leadership PACs during the 2011-2012election cycle was between $47,292.57and$456,415.89with a96% confidence level.

Step by step solution

01

Given Information 

Create a 90% confidence interval for the mean amount of money raised by all Leadership PACs during the 2011-2012 election cycle using this sample data. The Student's-t distribution should be used.

02

Explanation 

Now we start calculation:

x¯=$251,854.23,s=$521,130.41

The sample has a total of30measurements.

n=30,anddf=30-1=29

CL=0.96

α=1-CL

=1-0.96

=0.04a2

=0.02ta2

=t0.02

=2.150

EBM=ta2sn

EBM=2.150521,130.4130

EBM=$204,561.66

x¯-EBM=$251,854.23-$204,561.66

x¯-EBM=$47,292.57

x¯+EBM=$251,854.23+$204,561.66

x¯+EBM=$456,415.89

We estimate that the average amount of money raised by all Leadership PACs during the 2011-2012election season was between $200,000and$300,000,with a 96%confidence level$47,292.57and$456,415.89.

03

Final result 

We estimate that the mean amount of money raised by all Leadership PACs during the 2011-2012election cycle was between $47,292.57and$456,415.89with a96% confidence level.

Unlock Step-by-Step Solutions & Ace Your Exams!

  • Full Textbook Solutions

    Get detailed explanations and key concepts

  • Unlimited Al creation

    Al flashcards, explanations, exams and more...

  • Ads-free access

    To over 500 millions flashcards

  • Money-back guarantee

    We refund you if you fail your exam.

Over 30 million students worldwide already upgrade their learning with ÷ÈÓ°Ö±²¥!

One App. One Place for Learning.

All the tools & learning materials you need for study success - in one app.

Get started for free

Most popular questions from this chapter

Which distribution should you use for this problem?

In words, define the random variable X.

Use the following information to answer the next two exercises: Five hundred and eleven (511)homes in a certain southern California community are randomly surveyed to determine if they meet minimal earthquake preparedness recommendations. One hundred seventy-three (173)of the homes surveyed met the minimum recommendations for earthquake preparedness, and 338did not.

Find the confidence interval at the 90%Confidence Level for the true population proportion of southern California community homes meeting at least the minimum recommendations for earthquake preparedness.

a. (0.2975,0.3796)

b.(0.6270,0.6959)

c. (0.3041,0.3730)

d.(0.6204,0.7025)

Six different national brands of chocolate chip cookies were randomly selected at the supermarket. The grams of fat per serving are as follows: 8;8;10;7;9;9. Assume the underlying distribution is approximately normal.

a. Construct a 90%confidence interval for the population mean grams of fat per serving of chocolate chip cookies

sold in supermarkets.

i. State the confidence interval.

ii. Sketch the graph.

iii. Calculate the error bound.

b. If you wanted a smaller error bound while keeping the same level of confidence, what should have been changed in the study before it was done?

c. Go to the store and record the grams of fat per serving of six brands of chocolate chip cookies.

d. Calculate the mean.

e. Is the mean within the interval you calculated in part a? Did you expect it to be? Why or why not?

Suppose that the insurance companies did do a survey. They randomly surveyed 400drivers and found that 320claimed they always buckle up. We are interested in the population proportion of drivers who claim they always buckle up.

a. i. x = __________ ii. n = __________ iii. p′ = __________

b. Define the random variables Xand P', in words.

c. Which distribution should you use for this problem? Explain your choice.

d. Construct a 95%confidence interval for the population proportion who claim they always buckle up. i. State the confidence interval. ii. Sketch the graph. iii. Calculate the error bound.

e. If this survey were done by telephone, list three difficulties the companies might have in obtaining random results.

See all solutions

Recommended explanations on Math Textbooks

View all explanations

What do you think about this solution?

We value your feedback to improve our textbook solutions.

Study anywhere. Anytime. Across all devices.