/*! This file is auto-generated */ .wp-block-button__link{color:#fff;background-color:#32373c;border-radius:9999px;box-shadow:none;text-decoration:none;padding:calc(.667em + 2px) calc(1.333em + 2px);font-size:1.125em}.wp-block-file__button{background:#32373c;color:#fff;text-decoration:none} Q11BSC Technology. In Exercises 9鈥12,... [FREE SOLUTION] | 魅影直播

魅影直播

Technology. In Exercises 9鈥12, test the given claim by using the display provided from technology. Use a 0.05 significance level. Identify the null and alternative hypotheses, test statistic, P-value (or range of P-values), or critical value(s), and state the final conclusion that addresses the original claim.
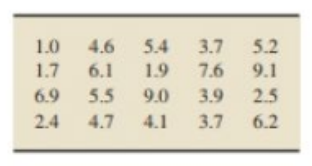
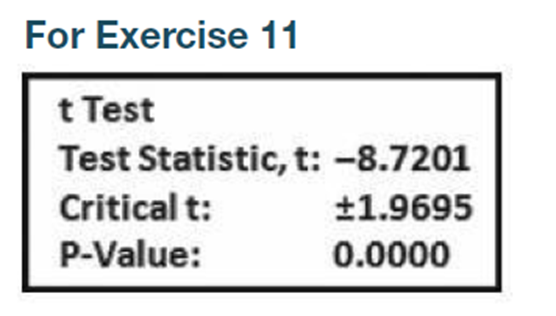
Old Faithful Data Set 23 鈥淥ld Faithful鈥 in Appendix B includes data from 250 random eruptions of the Old Faithful geyser. The National Park Service makes predictions of times to the next eruption, and the data set includes the errors (minutes) in those predictions. The accompanying Statdisk display results from using the prediction errors (minutes) to test the claim that the mean prediction error is equal to zero. Comment on the accuracy of the predictions.

Short Answer

Expert verified

The hypotheses are as follows.

\(\begin{array}{l}{H_0}:\mu = 0\\{H_1}:\mu \ne 0\end{array}\)

The test statistic is -8.7201, and the p-value is 0.0000.

The null hypothesis is rejected, which implies that there is insufficient evidence to support the claim that the population mean of the prediction error is equal to zero.

This means that the prediction of eruption for the next time is not accurate.

Step by step solution

01

Given information

A sample is taken from the eruption of an old faithful geyser with a sample size of 250 with the claim that the population mean of the prediction error in predicting the eruption is equal to zero.

02

State the hypotheses

The null hypothesis\({H_0}\)represents the population mean of the prediction error equal to 0. The alternate hypothesis\({H_1}\)represents the population mean of the prediction error, which is not equal to 0.

Let\(\mu \)be the population mean of the prediction error.

State the null and alternate hypotheses.

\(\begin{array}{l}{H_0}:\mu = 0\\{H_1}:\mu \ne 0\end{array}\)

03

State the test statistic and the p-value

The test statistic and the p-value are represented by the symbols\(t\)and\({\rm{P - value}}\),respectively.

The test statistic and p-value are obtained from the second row and the third row of the given output, respectively. Also, the critical value is obtained from the second row, as stated below.

\(\begin{array}{c}t \approx - 8.7201\\{\rm{P - value}} \approx 0.0000\\{\rm{Critical}}\;t = \pm 1.9695\end{array}\).

04

State the decision rule

Reject the null hypothesis when the absolute value of the observed test statistics is greater than the critical value. Otherwise, fail to reject the null hypothesis.

\(\begin{array}{c}\left| { - 8.7201} \right| = 8.7201\\ > 1.9695\\t > t\left( {{\rm{critical}}} \right)\end{array}\).

The absolute value of the observed test statistic is significantly larger than the critical value. This implies that there is sufficient evidence to reject the null hypothesis.

05

Conclusion

As the null hypothesis is rejected, it can be concluded that there is insufficient evidence to support the claim that the population mean of the prediction error is not equal to zero.

As the prediction errors are not equal to 0, the prediction of eruption for the next time is not accurate.

Unlock Step-by-Step Solutions & Ace Your Exams!

  • Full Textbook Solutions

    Get detailed explanations and key concepts

  • Unlimited Al creation

    Al flashcards, explanations, exams and more...

  • Ads-free access

    To over 500 millions flashcards

  • Money-back guarantee

    We refund you if you fail your exam.

Over 30 million students worldwide already upgrade their learning with 魅影直播!

One App. One Place for Learning.

All the tools & learning materials you need for study success - in one app.

Get started for free

Most popular questions from this chapter

Testing Claims About Proportions. In Exercises 9鈥32, test the given claim. Identify the null hypothesis, alternative hypothesis, test statistic, P-value, or critical value(s), then state the conclusion about the null hypothesis, as well as the final conclusion that addresses the original claim. Use the P-value method unless your instructor specifies otherwise. Use the normal distribution as an approximation to the binomial distribution, as described in Part 1 of this section.

Eliquis The drug Eliquis (apixaban) is used to help prevent blood clots in certain patients. In clinical trials, among 5924 patients treated with Eliquis, 153 developed the adverse reaction of nausea (based on data from Bristol-Myers Squibb Co.). Use a 0.05 significance level to test the claim that 3% of Eliquis users develop nausea. Does nausea appear to be a problematic adverse reaction?

Testing Claims About Proportions. In Exercises 9鈥32, test the given claim. Identify the null hypothesis, alternative hypothesis, test statistic, P-value, or critical value(s), then state the conclusion about the null hypothesis, as well as the final conclusion that addresses the original claim. Use the P-value method unless your instructor specifies otherwise. Use the normal distribution as an approximation to the binomial distribution, as described in Part 1 of this section.

Cell Phones and Cancer In a study of 420,095 Danish cell phone users, 135 subjects developed cancer of the brain or nervous system (based on data from the Journal of the National Cancer Institute as reported in USA Today). Test the claim of a somewhat common belief that such cancers are affected by cell phone use. That is, test the claim that cell phone users develop cancer of the brain or nervous system at a rate that is different from the rate of 0.0340% for people who do not use cell phones. Because this issue has such great importance, use a 0.005 significance level. Based on these results, should cell phone users be concerned about cancer of the brain or nervous system?

Explain how the P -value is obtained for a mean z-test in case of hypothesis test is

(a) left-tailed (b) right- tailed (c) two tailed

TV Viewing. According to Communications Industry Fore cast & Report, published by Veronis Suhler Stevenson, the average person watched 4.55hours of television per day in 2005. A random sample of 20people gave the following number of hours of television watched per day for last year.

At the 10%significance level, do the data provide sufficient evidence to conclude that the amount of television watched per day last year by the average person differed from that in 2005? (Note: x=4.760hours,s=2.297hours)

P-Values. In Exercises 17鈥20, do the following:

a. Identify the hypothesis test as being two-tailed, left-tailed, or right-tailed.

b. Find the P-value. (See Figure 8-3 on page 364.)

c. Using a significance level of = 0.05, should we reject or should we fail to reject ?

The test statistic of z = 1.00 is obtained when testing the claim that p>0.3.

See all solutions

Recommended explanations on Math Textbooks

View all explanations

What do you think about this solution?

We value your feedback to improve our textbook solutions.

Study anywhere. Anytime. Across all devices.