/*! This file is auto-generated */ .wp-block-button__link{color:#fff;background-color:#32373c;border-radius:9999px;box-shadow:none;text-decoration:none;padding:calc(.667em + 2px) calc(1.333em + 2px);font-size:1.125em}.wp-block-file__button{background:#32373c;color:#fff;text-decoration:none} Q38P Standard addition. Selenium from... [FREE SOLUTION] | ÷ÈÓ°Ö±²¥

÷ÈÓ°Ö±²¥

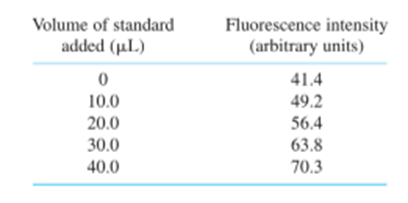
Standard addition. Selenium from 0.108 g of Brazil nuts was converted into the fluorescent product in Reaction 18-15, and extracted into 10.0 mL of cyclohexane. Then 2.00 mL of the cyclohexane solution were placed in a cuvet for fluorescence measurement. Standard additions of fluorescent product containingSe/mL are given in the table. Construct a standard addition graph to find the concentration of Se in the 2.00-mL unknown solution. Find the wt%of Se in the nuts and its uncertainty and 95% confidence interval

Short Answer

Expert verified

The interval is3.56±0.068⋅10−4%3.56±0.22⋅10−4%

Step by step solution

01

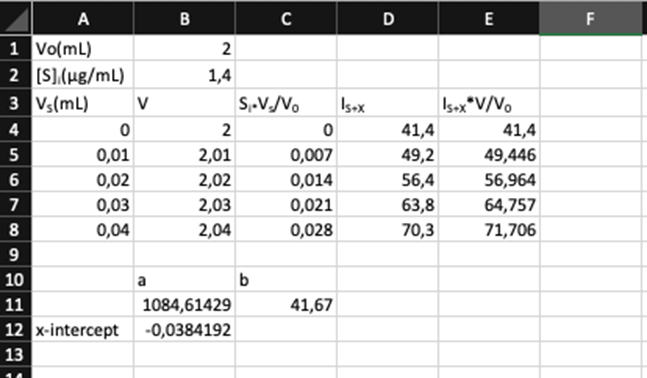
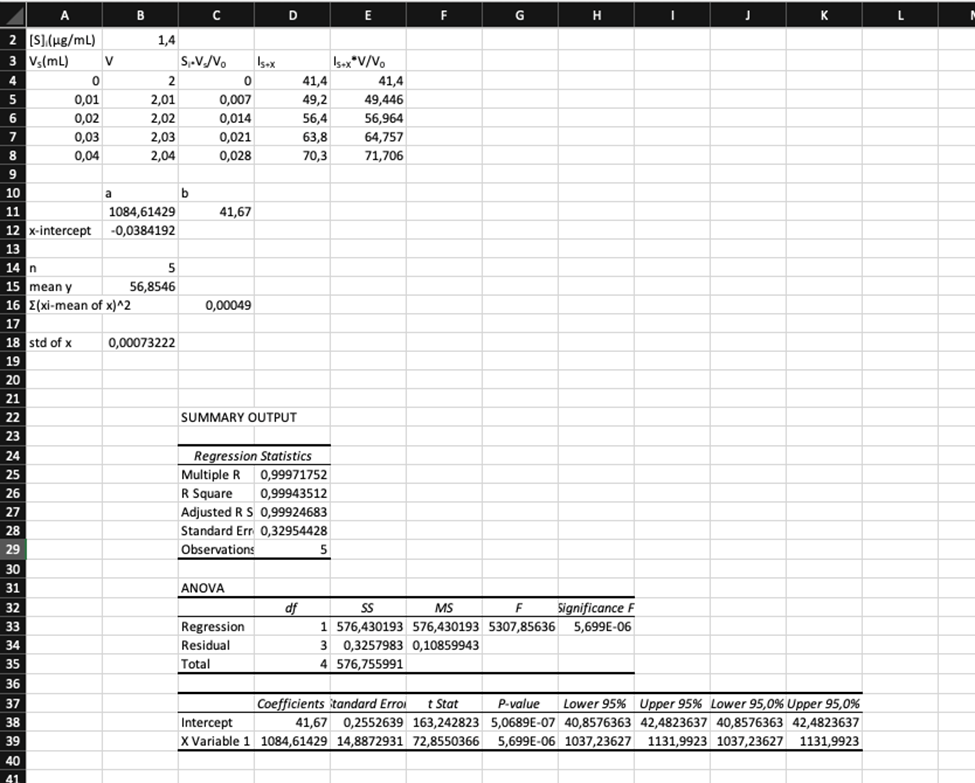
Find equation of intensity:

Is+X→fluorescence intensity from the unknown + standard addition V→total volume of (unknown + standard)V0→ fluorescence intensity from unknown initial concentration of Unknown initial concentration of standard VS→volume of standard.

Is+xVV0=Ix+Ix[X]iâ‹…[S]iâ‹…VsV0

02

Spreadsheet:

03

Graph

The graphIS+xVV0

Versus is,[S]iVsV0

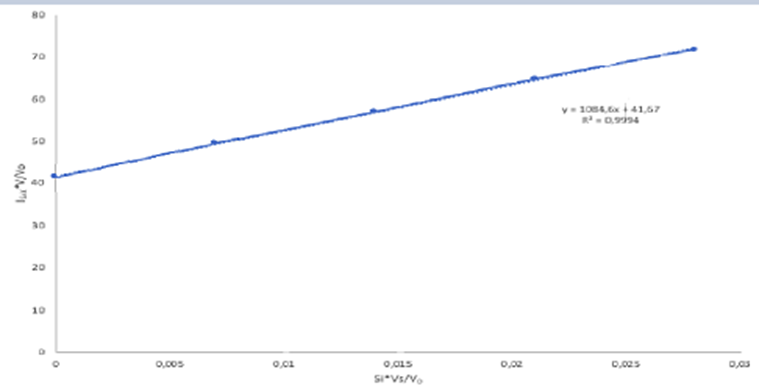
The x-intercept is the concentration of Se. We calculate x-intercept by dividing b / a. So, the concentration of Se is0.03842μ²µ/mL

04

Calculate :

w(Se)=m(Se)m(nuts)Where Mass of Se is,m(Se)=V⋅γ(Se)m(Se)=10mL⋅0.03842μg/mLm(Se)=0.3842μgw(Se)=0.3842⋅10−6g0.108gw(Se)=3.56⋅10−4%

05

Spreadsheet:

06

Calculate the interval:

The standard deviation of x-intercept is calculated by formula:

sy|a|⋅1n+y¯2a2⋅Σxi−x¯2

n is a number of data, y is a average of y,xiare individual values of x, and is average of x.

∑xi−X¯2

The relative uncertainty in the intercept is:

0.0007320.03842=1.91%

Uncertainty of :

0.0192⋅3.56⋅10−4%=6.84⋅10−6%3.56(±0.068)⋅10−4%

95% confidence interval is calculated:

±t. standard deviation

t is a Student's t. We read value from Table 4-4. The degrees of freedom are:

n - 2 = 5 - 2 =3

For 95% confidence level and 3 degrees of freedom, the value is 3.182.

3.182⋅0.068⋅10−4%=0.22⋅10−4%3.56(±0.22)⋅10−4%

Unlock Step-by-Step Solutions & Ace Your Exams!

  • Full Textbook Solutions

    Get detailed explanations and key concepts

  • Unlimited Al creation

    Al flashcards, explanations, exams and more...

  • Ads-free access

    To over 500 millions flashcards

  • Money-back guarantee

    We refund you if you fail your exam.

Over 30 million students worldwide already upgrade their learning with ÷ÈÓ°Ö±²¥!

One App. One Place for Learning.

All the tools & learning materials you need for study success - in one app.

Get started for free

Most popular questions from this chapter

18-8: What is an absorption spectrum?

Characteristic orange light produced by sodium in a flame is due to an intense emission called the sodium D line, which actually a doublet, with wavelength (measured in vacuum) of 589.157 88 and 589.755 37 nm. The index of refraction of air at a wavelength near 589 nm is 1.000 292 6. Calculate the frequency, wavelength, and wavenumber of each component of the D line, measured in air.

Preparing standards for a calibration curve.

(a) How much ferrous ethylene diammonium sulfate(FeH3NCH2CH2NH3SO42⋅4H2O,FM382.15)should be dissolved in a 500mL volumetric flask with1MH2SO4to obtain a stock solution with~500μgFe/mL2?

(b) When making stock solution (a), you actually weighed out 1.627 g of reagent. What is the Fe concentration in role="math" localid="1668357579931" 500μgFe/mL2?

(c) How would you prepare 500 mL of standard containing 1,2,3,4, and5μgFe/mL2in0.1MH2SO4infrom stock solution (b) using any Class A pipets from Table 2-4 with only 500 -mL volumetric flasks?

(d) To reduce the generation of chemical waste, describe how you could prepare 50 mL of standard containing, andinfrom stock solution (b) by serial dilution using any Class A pipets from Table 2-3 with only 50mL volumetric flasks?

18-26. A 2.00mL solution of apotransferrin was titrated as illustrated in Figure 18-11. It required 163L of 1.43 mM ferric nitrilotriacetate to reach the end point.

(a) Why does the slope of the absorbance versus volume graph change abruptly at the equivalence point?

(b) How many moles of Fe(III) (= ferric nitrilotriacetate) were required to reach the end point?

(c) Each apotransferrin molecule binds two ferric ions. Find the molar concentration of apotransferrin in the 2.00mL solution.

18-27. The iron-binding site of transferrin in Figure 18-8 can accommodate certain other metal ions besides Fe and certain other anions besidesData are given in the table for the titration of transferrin ( 3.57 mg in 2.00 mL ) with 6.64 mM Ga3+solution in the presence of the anion oxalate, C2O42-, and in the absence of a suitable anion. Prepare a graph similar to Figure 18-11, showing both sets of data. Indicate the theoretical equivalence point for the binding of one and two Ga3+ions per molecule of protein and the observed end point. How many Ga3+ions are bound to transferrin in the presence and in the absence of oxalate?

See all solutions

Recommended explanations on Chemistry Textbooks

View all explanations

What do you think about this solution?

We value your feedback to improve our textbook solutions.

Study anywhere. Anytime. Across all devices.