Chapter 6: Q. 39 (page 384)
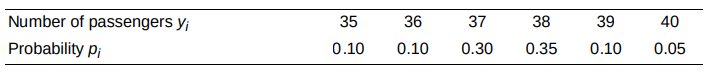
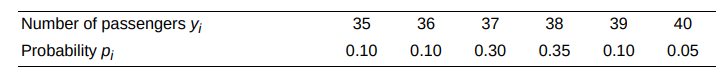
Airlines typically accept more reservations for a flight than the number of seats on the plane. Suppose that for a certain route, an airline accepts reservations on a plane that carries passengers. Based on experience, the probability distribution of the number of passengers who actually show up for a randomly selected flight is given in the following table. You can check that
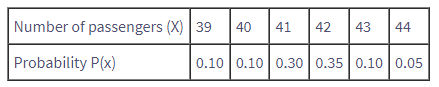
There is also a crew of two flight attendants and two pilots on each flight. Let the total number of people (passengers plus crew) on a randomly selected flight.
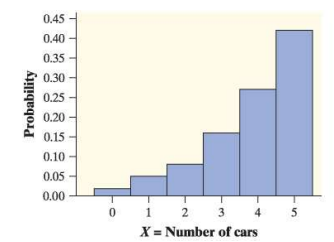
a. Make a graph of the probability distribution of . Describe its shape.
b. Find and interpret role="math" .
c. Calculate and interpret .
Short Answer
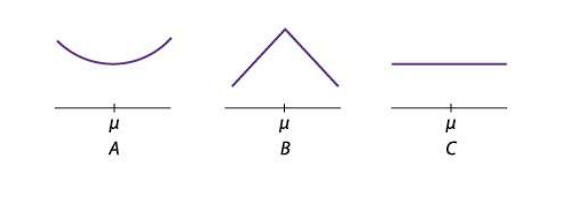
a. The distribution is symmetric.
b.
c.
Step by step solution
Part(a) Step 1 : Given information
Given table :

Part(a) Step 2 : Simplification
Since there are crews on each flight, so :
So, the new table is :
And so, the respective graph is :
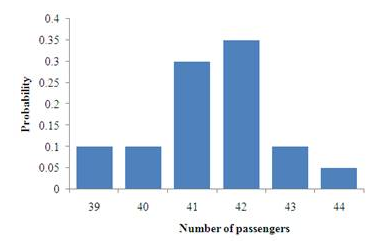
The distribution is symmetric.
Part(b) Step 1 : Given information
Given table :

Part(b) Step 2 : Simplification
stands for the number of passengers.
Each flight has four crew members, hence .
When the constant is added to each data value, the distribution's center is also enhanced by that constant value.
When the constant value is added to each data point, the center of the distribution is raised, resulting in average numbers of persons (passengers + staff) being randomly selected.
Part(c) Step 1 : Given information
Given table :
Part(c) Step 2 : Simplification
stands for the number of passengers.
Because each flight has four crew members, adding the constant to each data value has no effect on the distribution's spread; it remains intact.
When a constant value is added to each data point, the spread of the distribution is unaffected, and the number of persons (passengers + staff) for a randomly chosen aircraft varies on average around the mean = people.
Over 30 million students worldwide already upgrade their learning with ��Ӱֱ��!