Chapter 11: Q. 44 (page 755)
Regulating guns The National Gun Policy Survey asked a random sample of adults, "Do you think there should be a law that would ban possession of handguns except for the police and other authorized persons?" Here are the responses, broken down by the respondent's level of education:
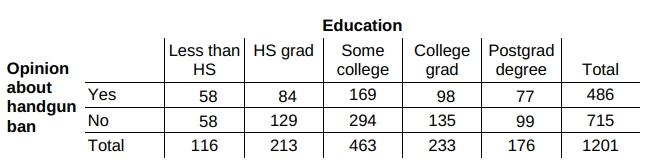
Do these data provide convincing evidence at the level of an association between education level and opinion about a handgun ban in the adult population?
Short Answer
No, the data is not convincing evidence at the level of an association.
Step by step solution
Given information
We need to find out whether the data provided is convincing evidence or not.

Explanation
We know that
The null hypothesis asserts that the variables are unrelated, whereas the alternative hypothesis asserts that they are.
is there is no association between opinion and education level.
is there is an association between opinion and education level.
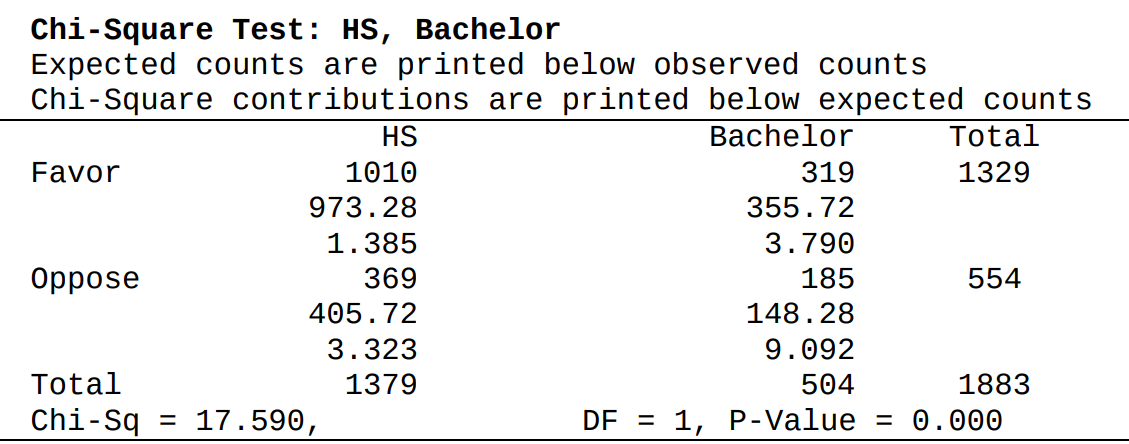
And expected frequencies are a product of row and column total divided by table total.
And The squared differences between the actual and predicted frequencies, divided by the expected frequency, make up the chi-square subtotals.
Therefore, the data is not convincing evidence at the level of an association.
Over 30 million students worldwide already upgrade their learning with ��Ӱֱ��!