Chapter 11: Q 17. (page 718)
Skittles® Statistics teacher Jason Mole sky contacted Mars, Inc., to ask about the color distribution for Skittles candies. Here is an excerpt from the response he received: “The original flavor blend for the Skittles Bite Size Candies is lemon, green apple, orange, strawberry and grape. They were chosen as a result of consumer preference tests we conducted. The flavor blend is percent of each flavor.”
a. State appropriate hypotheses for a significance test of the company’s claim.
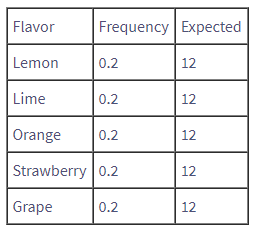
b. Find the expected counts for a random sample of candies.
c. How large a test statistic would you need to have significant evidence against the company’s claim at the α=0.05 level? At the level?
d. Create a set of observed counts for a random sample of candies that gives a value between and Show the calculation of your chi-square test statistic.
Short Answer
Part (a)
Part (b) Expected count for each flavor is
Part (c) If chi square statistic is greater than above critical values at specified level of significance then reject
Part (d)

Step by step solution
Part (a) Step 1: Given information
The flavor blend is of each flavor.
Sample size is candies.
Part (a) Step 2: Calculation
The null and alternative hypotheses:
Part (b) Step 1: Calculation
To get the predicted count, multiply each frequency of flavor by As a result, the projected count is,
Part (c) Step 1: Calculation
The degrees of freedom
The
For each degree of significance, various critical values will be used.
When significance level
Reject if the chi square statistic is greater than the crucial values at the selected level of significance.
Part (d) Step 1: Calculation
The frequency of the random sample is shown in the table below: 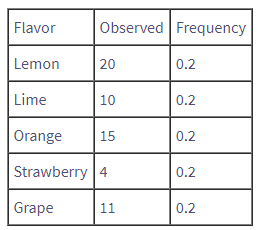
Using excel,
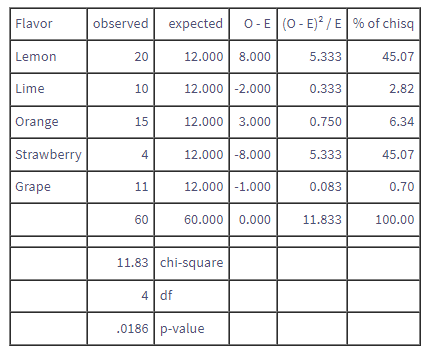
Therefore, thevalue is between and
Over 30 million students worldwide already upgrade their learning with ��Ӱֱ��!