Chapter 8: Estimating with Confidence
Q 83.
A quality control inspector will measure the salt content (in milligrams) in a random
sample of bags of potato chips from an hour of production. Which of the following would result in the smallest margin of error in estimating the mean salt content ?
a. confidence;
b. confidence;
c. confidence;
d. confidence;
e. n = 100 at any confidence level
Q 84.
Scientists collect data on the blood cholesterol levels (milligrams per deciliter of blood) of a random sample of laboratory rats. A confidence interval for the mean blood cholesterol level is to . Which of the following would cause the most worry about the validity of this interval?
a. There is a clear outlier in the data.
b. A stem plot of the data shows a mild right skew.
c. You do not know the population standard deviation .
d. The population distribution is not exactly Normal.
e. None of these are a problem when using a interval.
Q. 86.
Price cuts (4.2) Stores advertise price reductions to attract customers. What type of price
cut is most attractive? Experiments with more than one factor allow insight into
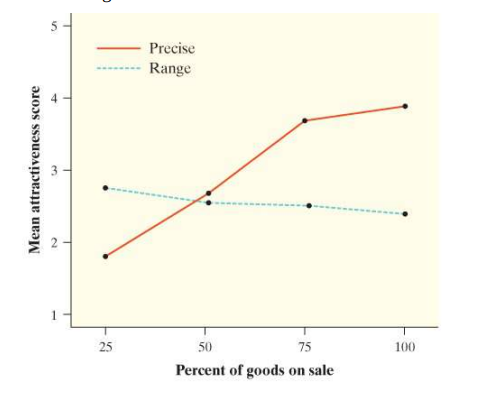
interactions between the factors. A study of the attractiveness of advertised price discounts
had two factors: percent of all foods on sale (25%, 50%, 75%, or 100%) and whether the discount was stated precisely (e.g., as in “60% off”) or as a range (as in “40% to 70% off”). Subjects rated the attractiveness of the sale on a scale of 1 to 7.
a. List the treatments for this experiment, assuming researchers will use all combinations of the two factors.
b. Describe how you would randomly assign 200 volunteer subjects to treatments.
c. Explain the purpose of the random assignment in part (b).
d. The figure shows the mean ratings for the eight treatments formed from the two factors.35 Based on these results, write a careful description of how percent on sale and precise discount versus range of discounts influence the attractiveness of a sale.
Q 9.
Shoes The AP Statistics class in Exercise 1 also asked an SRS of boys at their school how many pairs of shoes they have. A confidence interval for the true difference in the mean number of pairs of shoes for girls and
boys is .
a. Interpret the confidence interval.
b. Does the confidence interval give convincing evidence of a difference in the true mean number of pairs of shoes for boys and girls at the school? Explain your answer.
Q. R8.1
It’s critical Find the appropriate critical value for constructing a confidence interval in each of the following settings.
a. Estimating a population proportion p at a 94% confidence level based on an SRS of size 125
b. Estimating a population mean μ at a 99% confidence level based on an SRS of size 58
Q. R8.2
Batteries A company that produces AA batteries tests the lifetime of a randomsample of 30 batteries using a special device designed to imitate real-world use. Based onthe testing, the company makes the following statement: “Our AA batteries last an average of 430 to 470 minutes, and our confidence in that interval is 95%.”36
a. Determine the point estimate, margin of error, standard error, and sample standard
deviation.
b. A reporter translates the statistical announcement into “plain English” as follows: “95% of this company’s AA batteries last between 430 and 470 minutes.” Comment on this interpretation.
c. Your friend, who has just started studying statistics, claims that there is a 95% probability that the mean lifetime will fall between 430 and 470 minutes. Do you agree? Explain your reasoning.
d. Give a statistically correct interpretation of the confidence level that could be published in a newspaper report.
Q. R8.3
We love football! A Gallup poll conducted telephone interviews with a random sample of adults aged 18 and older. Data were obtained for 1000 people. Of these, 370 said that football is their favorite sport to watch on television.
a. Define the parameter p in this setting.
b. What point estimator will you use to estimate p? What is the value of the point estimate?
c. Do you believe that the value of the point estimate is equal to the value of p? Explain your answer.
Q. R8.4
Running red lights A random digit dialing telephone survey of 880 drivers asked, “Recalling the last ten traffic lights you drove through, how many of them were red when you entered the intersections?” Of the 880 respondents, 171 admitted that at least one light had been red.37
a. Construct and interpret a 95% confidence interval for the population proportion.
b. Nonresponse is a practical problem for this survey—only 21.6% of calls that reached a live person were completed. Another practical problem is that people may not give truthful answers. What is the likely direction of the bias: Do you think more or fewer than 171 of the 880 respondents really ran a red light? Why? Are these sources of bias included in the margin of error?
Q. R8.5
Engine parts A random sample of 16 of the more than auto engine crankshafts produced in one day was selected. Here are measurements (in millimeters) of a critical component on these crankshafts:

a. Construct and interpret a confidence interval for the mean length of this component on all the crankshafts produced on that day.
b. The mean length is supposed to be mm but can drift away from this target during production. Does your interval from part (a) suggest that the mean has drifted from mm? Explain your answer.
Q. R8.6
Do you go to church? The Gallup Poll plans to ask a random sample of adults
whether they attended a religious service in the last 7 days. How large a sample would be required to obtain a margin of error of at most 0.01 in a 99% confidence interval for the population proportion who would say that they attended a religious service?
