/*! This file is auto-generated */ .wp-block-button__link{color:#fff;background-color:#32373c;border-radius:9999px;box-shadow:none;text-decoration:none;padding:calc(.667em + 2px) calc(1.333em + 2px);font-size:1.125em}.wp-block-file__button{background:#32373c;color:#fff;text-decoration:none} Q 50. Pair-a-dice The dotplot shows th... [FREE SOLUTION] | ÷ÈÓ°Ö±²¥

÷ÈÓ°Ö±²¥

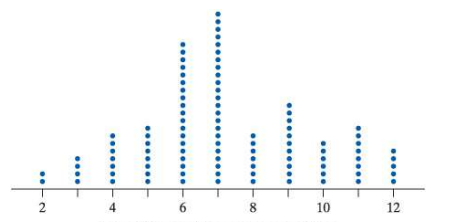
Pair-a-dice The dotplot shows the results of rolling a pair of fair, six-sided dice and Page Number: 48 finding the sum of the up-faces 100 times. Describe the shape of the distribution.

Short Answer

Expert verified

Roughly symmetric

Single peak

No gaps

Step by step solution

01

 Step 1. Given information.

The dotplot shows the results of rolling a pair of fair, six-sided dice and Page Number: 48 finding the sum of the up-faces 100 times.

02

 Step 2. The shape of the distribution.  

Because the peak in the dotplot is roughly in the middle of the graph, we can conclude that the distribution is roughly symmetric.

We notice that the distribution has a single peak at 7, and there appear to be no gaps in the dotplot.

Roughly symmetric

Single peak

No gaps

Unlock Step-by-Step Solutions & Ace Your Exams!

  • Full Textbook Solutions

    Get detailed explanations and key concepts

  • Unlimited Al creation

    Al flashcards, explanations, exams and more...

  • Ads-free access

    To over 500 millions flashcards

  • Money-back guarantee

    We refund you if you fail your exam.

Over 30 million students worldwide already upgrade their learning with ÷ÈÓ°Ö±²¥!

One App. One Place for Learning.

All the tools & learning materials you need for study success - in one app.

Get started for free

Most popular questions from this chapter

When comparing two distributions, it would be best to use relative frequency histograms rather than frequency histograms when

a. the distributions have different shapes.

b. the distributions have different amounts of variability.

c. the distributions have different centers.

d. the distributions have different numbers of observations.

e. at least one of the distributions has outliers

Quiz gradesRefer to Exercise 87.

(a) Find the range of Joey’s first 14 quiz grades and the range of Joey’s quiz grades after his unexcused absence.

(b) Explain what part (a) suggests about using the range as a measure of variability for a distribution of quantitative data.

Who buys cars? A car dealer keeps records on car buyers for future marketing purposes. The table gives information on the last 4 buyers.

Part (a). Identify the individuals in this data set.

Part (b). What variables were measured? Classify each as categorical or quantitative.

Python eggs How is the hatching of water python eggs influenced by the temperature of the snake’s nest? Researchers randomly assigned newly laid eggs to one of three water temperatures: hot, neutral, or cold. Hot duplicates the extra warmth provided by the mother python, and cold duplicates the absence of the mother. The two-way table summarizes the data on whether or not the eggs hatched.

(a) What percent of eggs were randomly assigned to hot water?

(b) What proportion of eggs in the study hatched?

(c) What percent of eggs in the study were randomly assigned to cold or neutral water and hatched?

Going to school Students in a high school statistics class were given data about the main method of transportation to school for a group of 30 students. They produced the pictograph shown. Explain how this graph is misleading.

See all solutions

Recommended explanations on Math Textbooks

View all explanations

What do you think about this solution?

We value your feedback to improve our textbook solutions.

Study anywhere. Anytime. Across all devices.