/*! This file is auto-generated */ .wp-block-button__link{color:#fff;background-color:#32373c;border-radius:9999px;box-shadow:none;text-decoration:none;padding:calc(.667em + 2px) calc(1.333em + 2px);font-size:1.125em}.wp-block-file__button{background:#32373c;color:#fff;text-decoration:none} Q 101. File sizes How much storage spac... [FREE SOLUTION] | ÷ÈÓ°Ö±²¥

÷ÈÓ°Ö±²¥

File sizes How much storage space does your music use? Here is a dotplot of the file sizes (to the nearest tenth of a megabyte) for 18 randomly selected files on Nathaniel’s mp3 player:

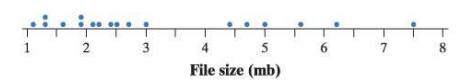
(a) The distribution of file size has a mean of x¯=3.2megabytes and a standard deviation ofsx=1.9 megabytes. Interpret the standard deviation.

(b) Suppose the music file that takes up 7.5 megabytes of storage space is replaced with another version of the file that only takes up 4 megabytes. How would this affect the mean and the standard deviation? Justify your answer.

Short Answer

Expert verified

Part (a) The storage space of the 18 files in the sample is expected to vary by 1.9 megabytes on average, compared to the mean of 3.2 megabytes.

Part (b) Reductions in the mean and the standard deviation fall.

Step by step solution

01

Part (a) Step 1. Given information.

The given mean and standard deviation are 3.2 and 1.9 respectively.

02

Part (a) Step 2. Interpret the standard deviation.

The standard deviation is a measure of how much the data values deviate from the mean.

The storage space of the 18 files in the sample is expected to vary by 1.9 megabytes on average, compared to the mean of 3.2 megabytes.

03

Part (b) Step 1. affect the mean and the standard deviation.

The most significant data value, 7.5, is replaced with 4.

The data value of 7.5 is the greatest and looks to be an outlier since it is separated from the other dots in the dotplot by a considerable gap. Outliers have a substantial influence on the mean, so if we reduce an outlier, we can expect the mean to drop as well.

We also see that the new number 4 is closer to the mean than the previous value of 7.5. We expect the standard deviation to drop (as 4 is closer to the mean than 7.5) since the standard deviation indicates the average deviation of the data values from the mean.

Unlock Step-by-Step Solutions & Ace Your Exams!

  • Full Textbook Solutions

    Get detailed explanations and key concepts

  • Unlimited Al creation

    Al flashcards, explanations, exams and more...

  • Ads-free access

    To over 500 millions flashcards

  • Money-back guarantee

    We refund you if you fail your exam.

Over 30 million students worldwide already upgrade their learning with ÷ÈÓ°Ö±²¥!

One App. One Place for Learning.

All the tools & learning materials you need for study success - in one app.

Get started for free

Most popular questions from this chapter

The histogram shows the heights of 300 randomly selected high school students. Which of the following is the best description of the shape of the distribution of heights?

a. Roughly symmetric and single-peaked

b. Roughly symmetric and double-peaked

c. Roughly symmetric and multi-peaked

d. Skewed to the left

e. Skewed to the right

Enhancing creativity Do external rewards—things like money, praise, fame, and grades —promote creativity? Researcher Teresa Amabile recruited 47 experienced creative writers who were college students and divided them at random into two groups. The students in one group were given a list of statements about external reasons (E) for writing, such as public recognition, making money, or pleasing their parents. Students in the other group were given a list of statements about internal reasons (I) for writing, such as expressing yourself and enjoying wordplay. Both groups were then instructed to write a poem about laughter. Each student’s poem was rated separately by 12 different poets using a creativity scale. 26 These ratings were averaged to obtain an overall creativity score for each poem. Parallel dotplots of the two groups’ creativity scores are shown here.

Part (a). Is the variability in creativity scores similar or different for the two groups? Justify your answer.

Part (b). Do the data suggest that external rewards promote creativity? Justify your answer.

Making money The parallel dotplots show the total family income of randomly chosen individuals from Indiana (38 individuals) and New Jersey (44 individuals). Compare the distributions of total family incomes in these two samples..

ShakespeareThe histogram shows the distribution of lengths of words used in Shakespeare’s plays.

(a) Find the median word length in Shakespeare’s plays from the histogram. Explain your method clearly.

(b) Calculate the mean of the distribution. Show your work.

Hispanic origins Here is a pie chart prepared by the Census Bureau to show the origin of the more than 50 million Hispanics in the United States in 2010. About what percent of Hispanics are Mexican? Puerto Rican?

See all solutions

Recommended explanations on Math Textbooks

View all explanations

What do you think about this solution?

We value your feedback to improve our textbook solutions.

Study anywhere. Anytime. Across all devices.