Chapter 10: Q. R 10.6 (page 696)
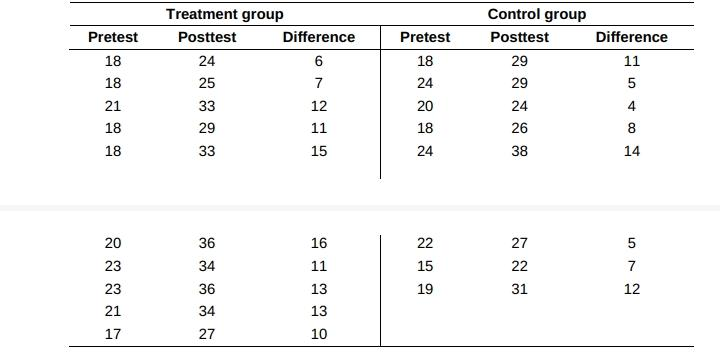
Each day I am getting better in math A "subliminal" message is below our threshold of awareness but may nonetheless influence us. Can subliminal messages help students learn math? A group of students who had failed the mathematics part of the City University of New York Skills Assessment Test agreed to participate in a study to find out. All received a daily subliminal message, flashed on a screen too rapidly to be consciously read. The treatment group of students (assigned at random) was exposed to "Each day I am getting better in math." The control group of students was exposed to a neutral message, "People are walking on the street." All students participated in a summer program designed to improve their math skills, and all took the assessment test again at the end of the program. The following table gives data on the subjects' scores before and after the program.

a. Explain why a two-sample t-test and not a paired t-test is the appropriate inference procedure in this setting.
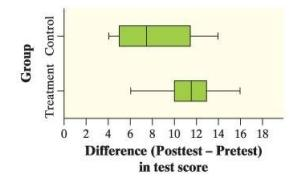
b. The following boxplots display the differences in pretest and post-test scores for the students in the control (C) and treatment (T) groups. Write a few sentences comparing the performance of these two groups.
c. Do the data provide convincing evidence at the significance level that subliminal messages help students like the ones in this study learn math, on average?
d. Can we generalize these results to the population of all students who failed the mathematics part of the City University of New York Skills Assessment Test? Why or why not?
Short Answer
(a) As students are assigned to one of the samples randomly.
(b) The Control distribution is heavily skewed to the right, whereas the Treatment distribution is marginally tilted to the left. The Treatment group's center is higher than the Control group's center. The spread between the two distributions appears to be similar. The distributions do not appear to have any outliers.
(c) No, There is no convincing evidence for subliminal messages that help students like the ones in this study learn math, on average.
(d) No, we can not generalize the result of all the students failed in mathematics.
Step by step solution
Part (a) Step 1: Given information
We need to find the reason for the two-sample t-test.
Part (a) Step 2: Explanation
The first sample contains the treatment group's ten pupils, whereas the second sample comprises the control group's eight students.
Because the students were assigned to one of the samples at random, the students in the two samples will be completely unrelated, making the two-sample t-methods suitable.
Part (b) Step 1: Given information
We need to interpret the given boxplot.

Part (b) Step 2: Explanation
We know that
- Because the box of the boxplot is to the left between the whiskers, the Control distribution is heavily skewed to the right. Because the box of the boxplot leans somewhat to the right between the whiskers, the Treatment distribution is slightly skewed to the left.
- Because the box of the Treatment boxplot lies further to the right than the box of the Control boxplot, the center of the Treatment group is higher than the center of the Control group.
- Because the two boxplots are almost the same width, the spread of the two distributions seems to be about the same.
- Unusual features: There appear to be no outliers in the distributions, as neither boxplot has independent dots.
Part (c) Step 1: Given information
We need to find whether there is convincing for evidence subliminal messages help students like the ones in this study learn math, on average.

Part (c) Step 2: Explanation
We know that
We know that
The null hypothesis asserts that the variables are unrelated, whereas the alternative hypothesis asserts that they are.
where true mean difference for students does not receive the treatment.
And true mean difference for students receiving the treatment.
And expected frequencies are a product of row and column total divided by table total.
And The squared differences between the actual and predicted frequencies, divided by the expected frequency, make up the chi-square subtotals.
Therefore, the data is no convincing evidence for subliminal messages that help students like the ones in this study learn math, on average.
Part (d) Step 1: Given information
We need to find whether the result can be generalized or not.

Part (d) Step 2: Explanation
We know that
- The kids opted to participate, the sample is not random, and it is possible that some students declined to participate.
- The students who accepted to participate may have different features than those who refused, causing us to continually overestimate or underestimate the mean difference.
This means that we can't extrapolate the findings to the entire population of students who failed the mathematics section of the City University of New York Skills Assessment Tests, because we can't be sure whether the differences are due to the treatment or to the students' different characteristics (compared to the general population).
Over 30 million students worldwide already upgrade their learning with ��Ӱֱ��!