/*! This file is auto-generated */ .wp-block-button__link{color:#fff;background-color:#32373c;border-radius:9999px;box-shadow:none;text-decoration:none;padding:calc(.667em + 2px) calc(1.333em + 2px);font-size:1.125em}.wp-block-file__button{background:#32373c;color:#fff;text-decoration:none} Q51E The article 鈥淎 Thin-Film Oxyge... [FREE SOLUTION] | 魅影直播

魅影直播

The article 鈥淎 Thin-Film Oxygen Uptake Test for the Evaluation of Automotive Crankcase Lubricants鈥 (Lubric. Engr., 1984: 75鈥83) reportedthe following data on oxidation-induction time (min) for various commercial oils:

87 103 130 160 180 195 132 145 211 105 145

153 152 138 87 99 93 119 129

a. Calculate the sample variance and standard deviation.

b. If the observations were re expressed in hours, what would be the resulting values of the sample variance and sample standard deviation? Answer without actually performing the re expression

Short Answer

Expert verified

a. The sample variance is 1264.766.The standard deviation is 35.564.

b. The sample variance is 0.351.The standard deviation is 0.593.

Step by step solution

01

Given information

The data on oxidation-induction time (min) for various commercial oils is provided

02

Compute the sample variance and standard deviation

Let x represent the sample values.

The sample mean is computed as,

\(\begin{array}{c}\bar x &=& \frac{{\sum {{x_i}} }}{n}\\ &=& \frac{{87 + 103 + 130 + ... + 119 + 129}}{{18}}\\ \approx 134.89\end{array}\)

Thus, the sample mean is 134.89 min.

The sample variance is given as,

\(\begin{array}{c}{s^2} &=& \frac{{\sum {{{\left( {{x_i} - \bar x} \right)}^2}} }}{{n - 1}}\\ &=& \frac{{{S_{xx}}}}{{n - 1}}\end{array}\)

The calculations are represented as,

\({x_i}\)

\({x_i} - \bar x\)

\({\left( {{x_i} - \bar x} \right)^2}\)

87

-47.3333

2240.441289

103

-31.3333

981.7756889

130

-4.3333

18.77748889

160

25.6667

658.7794889

180

45.6667

2085.447489

195

60.6667

3680.448489

132

-2.3333

5.44428889

145

10.6667

113.7784889

211

76.6667

5877.782889

105

-29.3333

860.4424889

145

10.6667

113.7784889

153

18.6667

348.4456889

152

17.6667

312.1122889

138

3.6667

13.44468889

87

-47.3333

2240.441289

99

-35.3333

1248.442089

93

-41.3333

1708.441689

119

-15.3333

235.1100889

129

-5.3333

28.44408889


22771.77849

Substituting the values, the variance is given as,

\(\begin{array}{c}{s^2} &=& \frac{{\sum {{{\left( {{x_i} - \bar x} \right)}^2}} }}{{n - 1}}\\ &=& \frac{{22765.7899}}{{19 - 1}}\\ &=& 1264.766\end{array}\)

Therefore, the sample variance is 1264.77 min square.

The standard deviation is computed as,

\(\begin{array}{c}s &=& \sqrt {{s^2}} \\ &=& \sqrt {1264.766} \\ &=& 35.564\end{array}\)

Therefore, the standard deviation is 35.564 min.

03

Compute the sample variance and standard deviation

b.

Referring to part a, the sample variance is 1264.766 min and the sample standard deviation is 35.564 min.

If the observations wereexpressed in hours,the measures of variability change as per the constant change in each of the sample observations.

In this case, each observation would be divided by 60 to transform in terms of hours.

The variance measure for the observations expressed in hours is computed as follows,

\(\begin{array}{c}{\left( {{s^{'}}} \right)^2} &=& \frac{{{s^2}}}{{{{60}^2}}}\\ &=& \frac{{1264.766}}{{{{60}^2}}}\\ &=& 0.351\end{array}\)

The standard deviation is computed as,

\(\begin{array}{c}{s^{'}} &=& \frac{s}{{60}}\\ &=& \frac{{35.564}}{{60}}\\ &=& 0.593\end{array}\)

Therefore, if the data is re expressed in hours, the variance and standard deviation is 0.351 hour square and 0.593 hour respectively.

Unlock Step-by-Step Solutions & Ace Your Exams!

  • Full Textbook Solutions

    Get detailed explanations and key concepts

  • Unlimited Al creation

    Al flashcards, explanations, exams and more...

  • Ads-free access

    To over 500 millions flashcards

  • Money-back guarantee

    We refund you if you fail your exam.

Over 30 million students worldwide already upgrade their learning with 魅影直播!

One App. One Place for Learning.

All the tools & learning materials you need for study success - in one app.

Get started for free

Most popular questions from this chapter

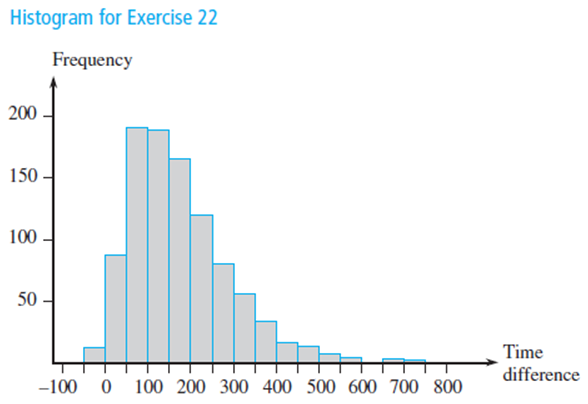
How does the speed of a runner vary over the course of a marathon (a distance of 42.195 km)? Consider determining both the time to run the first 5 km and the time to run between the 35-km and 40-km points, and then subtracting the former time from the latter time. A positive value of this difference corresponds to a runner slowing down toward the end of the race. The accompanying histogram is based on times of runners who participated in several different Japanese marathons (鈥淔actors Affecting Runners鈥 Marathon Performance,鈥 Chance, Fall, 1993: 24鈥30).What are some interesting features of this histogram? What is a typical difference value? Roughly what proportion of the runners ran the late distance more quickly than the early distance?

The accompanying frequency distribution of fracture strength (MPa) observations for ceramic bars fired in aparticular kiln appeared in the article 鈥淓valuating TunnelKiln Performance鈥 (Amer. Ceramic Soc. Bull., Aug.1997: 59鈥63).

Class81-<83 83-<85 85-<87 87-<89 89-<91

Frequency6 7 17 30 43

Class91-<93 93-<95 95-<97 97-<99

Frequency28 22 13 3

  1. Construct a histogram based on relative frequencies, and comment on any interesting features.
  2. What proportion of the strength observations are at least 85? Less than 95?

c. Roughly what proportion of the observations are less than 90?

A mutual fund is a professionally managed investment scheme that pools money from many investors and invests in a variety of securities. Growth funds focus primarily on increasing the value of investments, whereas blended funds seek a balance between current income and growth. Here is data on the expense ratio (expenses as a % of assets, from www .morningstar.com) for samples of 20 large-cap balanced

funds and 20 large-cap growth funds (鈥渓argecap鈥 refers to the sizes of companies in which the funds invest; the population sizes are 825 and 762,

respectively):

Bl 1.03 1.23 1.10 1.64 1.30

1.27 1.25 0.78 1.05 0.64

0.94 2.86 1.05 0.75 0.09

0.79 1.61 1.26 0.93 0.84

Gr 0.52 1.06 1.26 2.17 1.55

0.99 1.10 1.07 1.81 2.05

0.91 0.79 1.39 0.62 1.52

1.02 1.10 1.78 1.01 1.15

a. Calculate and compare the values of\(\bar x\),\(\tilde x\), and sfor the two types of funds.

b. Construct a comparative boxplot for the two types of funds, and comment on interesting features.

Here is a stem-and-leaf display of the escape time data introduced in Exercise 36 of this chapter.

32

55

33

49

34


35

6699

36

34469

37

3345

38

9

39

2347

40

23

41


42

4

a. Determine the value of the fourth spread.

b. Are there any outliers in the sample? Any extreme outliers?

c. Construct a boxplot and comment on its features.

d. By how much could the largest observation, currently 424, be decreased without affecting the value of the fourth spread?

a. If a constant cis added to each \({x_i}\)in a sample, yielding \({y_i} = {x_i} + c\), how do the sample mean and median of the \({y_i}'s\)relate to the mean and median of the\({x_i}'s\)? Verify your conjectures.

b. If each \({x_i}\)is multiplied by a constant c,yielding \({y_i} = c{x_i}\), answer the question of part (a). Again, verify your conjectures.

See all solutions

Recommended explanations on Math Textbooks

View all explanations

What do you think about this solution?

We value your feedback to improve our textbook solutions.

Study anywhere. Anytime. Across all devices.