/*! This file is auto-generated */ .wp-block-button__link{color:#fff;background-color:#32373c;border-radius:9999px;box-shadow:none;text-decoration:none;padding:calc(.667em + 2px) calc(1.333em + 2px);font-size:1.125em}.wp-block-file__button{background:#32373c;color:#fff;text-decoration:none} Q49E There are \({\rm{40}}\) students... [FREE SOLUTION] | 魅影直播

魅影直播

There are \({\rm{40}}\) students in an elementary statistics class. On the basis of years of experience, the instructor knows that the time needed to grade a randomly chosen first examination paper is a random variable with an expected value of \({\rm{6}}\)min and a standard deviation of \({\rm{6}}\)min.

a. If grading times are independent and the instructor begins grading at \({\rm{6:50}}\) p.m. and grades continuously, what is the (approximate) probability that he is through grading before the \({\rm{11:00}}\) p.m. TV news begins?

b. If the sports report begins at \({\rm{11:10,}}\) what is the probability that he misses part of the report if he waits until grading is done before turning on the TV?

Short Answer

Expert verified

a) \(P\left( {{T_0}拢250} \right) = 0.6026\)

b) \({\rm{P}}\left( {{{\rm{T}}_{\rm{0}}}{\rm{ > 260}}} \right){\rm{ = 0}}{\rm{.2981}}\)

Step by step solution

01

Definition of standard deviation

The square root of the variance is the standard deviation of a random variable, sample, statistical population, data collection, or probability distribution. It is less resilient in practice than the average absolute deviation, but it is algebraically easier.

02

Determining the (approximate) probability that he is through grading before the \({\rm{11:00}}\) p.m. TV news begins

There is a total of 250 minutes between 6:50 PM and \({\rm{11:00PM}}\). The sum of the 40 random variables provided in the exercise can be used to indicate total grading time (mean 6 minutes, standard deviation 6 minutes). Define it as follows:

\({{\rm{T}}_{\rm{0}}}{\rm{ = }}{{\rm{X}}_{\rm{1}}}{\rm{ + }}{{\rm{X}}_{\rm{2}}}{\rm{ + \ldots + }}{{\rm{X}}_{{\rm{40}}}}{\rm{.}}\)

This random variable's mean value is

\({{\rm{\mu }}_{{{\rm{T}}_{\rm{0}}}}}{\rm{ = n \times \mu = 40 \times 6 = 240,}}\)

as well as the standard deviation

\({{\rm{\sigma }}_{{{\rm{T}}_{\rm{0}}}}}{\rm{ = }}\sqrt {\rm{n}} {\rm{ \times \sigma = }}\sqrt {{\rm{40}}} {\rm{ \times 6 = 37}}{\rm{.95}}{\rm{.}}\)

It is simple to determine the requested probability by determining the mean and standard deviation of the random variable \({{\rm{T}}_{\rm{0}}}\) as follows:

\(\begin{array}{*{20}{c}}{{\rm{P}}\left( {{{\rm{T}}_{\rm{0}}}{\rm{拢 250}}} \right)}&{{\rm{ = P}}\left( {\frac{{{{\rm{T}}_{\rm{0}}}{\rm{ - }}{{\rm{\mu }}_{{{\rm{T}}_{\rm{0}}}}}}}{{{{\rm{\sigma }}_{{{\rm{T}}_{\rm{0}}}}}}}{\rm{拢 }}\frac{{{\rm{250 - 240}}}}{{{\rm{37}}{\rm{.95}}}}} \right){\rm{ = P(Z拢 0}}{\rm{.26)}}}\\{}&{\mathop {\rm{ = }}\limits^{{\rm{(1)}}} {\rm{0}}{\rm{.6026}}}\end{array}\)

(\({\rm{1}}\)): from the appendix's normal probability table. Software can also be used to calculate the likelihood.

03

Determining the probability that he misses part of the report if he waits until grading is done before turning on the TV

There are \({\rm{260}}\) minutes left until the sports report starts. The following statement is correct:

\(\begin{array}{*{20}{c}}{{\rm{P}}\left( {{{\rm{T}}_{\rm{0}}}{\rm{ > 260}}} \right){\rm{ = P}}\left( {\frac{{{{\rm{T}}_{\rm{0}}}{\rm{ - }}{{\rm{\mu }}_{{{\rm{T}}_{\rm{0}}}}}}}{{{{\rm{\sigma }}_{{{\rm{T}}_{\rm{0}}}}}}}{\rm{ > }}\frac{{{\rm{260 - 240}}}}{{{\rm{37}}{\rm{.95}}}}} \right){\rm{ = P(Z > 0}}{\rm{.53)}}}\\{\mathop {\rm{ = }}\limits^{{\rm{(1)}}} {\rm{0}}{\rm{.2981}}{\rm{.}}}\end{array}\)

Unlock Step-by-Step Solutions & Ace Your Exams!

  • Full Textbook Solutions

    Get detailed explanations and key concepts

  • Unlimited Al creation

    Al flashcards, explanations, exams and more...

  • Ads-free access

    To over 500 millions flashcards

  • Money-back guarantee

    We refund you if you fail your exam.

Over 30 million students worldwide already upgrade their learning with 魅影直播!

One App. One Place for Learning.

All the tools & learning materials you need for study success - in one app.

Get started for free

Most popular questions from this chapter

Let \({\rm{X}}\)denote the courtship time for a randomly selected female鈥搈ale pair of mating scorpion flies (time from the beginning of interaction until mating). Suppose the mean value of\({\rm{X}}\) is \({\rm{120}}\) min and the standard deviation of \({\rm{X}}\) is \({\rm{110}}\) min (suggested by data in the article 鈥淪hould I Stay or Should I Go? Condition- and Status-Dependent Courtship Decisions in the Scorpion Fly Panorpa Cognate鈥 (Animal Behavior, \({\rm{2009: 491 - 497}}\))). transmitted, there is a \({\rm{ 10\% }}\)chance of a transmission error (a \({\rm{0}}\)becoming a \({\rm{1}}\) or a \({\rm{1}}\)becoming a \({\rm{0}}\)). Assume that bit errors occur independently of one another.

a. Is it plausible that \({\rm{X}}\) is normally distributed?

b. For a random sample of \({\rm{50}}\) such pairs, what is the (approximate) probability that the sample mean courtship time is between \({\rm{100}}\) min and \({\rm{125}}\) min?

c. For a random sample of \({\rm{50}}\) such pairs, what is the (approximate) probability that the total courtship time exceeds \({\rm{150}}\) hrs.?

d. Could the probability requested in (b) be calculated from the given information if the sample size were \({\rm{15}}\) rather than \({\rm{50}}\)? Explain.

A surveyor wishes to lay out a square region with each side having length\({\rm{L}}\). However, because of a measurement error, he instead lays out a rectangle in which the north-south sides both have length \({\rm{X}}\) and the east-west sides both have length\({\rm{Y}}\). Suppose that \({\rm{X}}\) and \({\rm{Y}}\) are independent and that each is uniformly distributed on the interval \({\rm{(L - A,L + A)}}\) (where \({\rm{0 < A < L}}\) ). What is the expected area of the resulting rectangle?

The mean weight of luggage checked by a randomly selected tourist-class passenger flying between two cities on a certain airline is\({\bf{40}}\)lb, and the standard deviation is\({\bf{10}}\)lb. The mean and standard deviation for a business class passenger is\({\bf{30}}\)lb and\({\bf{6}}\)lb, respectively.

a. If there are\({\bf{12}}\)business-class passengers and\({\bf{50}}\)tourist-class passengers on a particular flight, what is the expected value of total luggage weight and the standard deviation of total luggage weight?

b. If individual luggage weights are independent, normally distributed RVs, what is the probability that total luggage weight is at most\({\bf{2500}}\)lb?

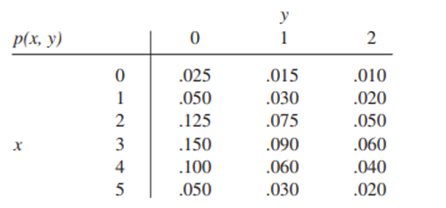
The joint probability di\({\rm{Y}} \le {\rm{1) = 0}}{\rm{.12}}\)stribution of the number \({\rm{X}}\) of cars and the number \({\rm{Y}}\) of buses per signal cycle at a proposed left-turn lane is displayed in the accompanying joint probability table.

a. What is the probability that there is exactly one car and exactly one bus during a cycle?

b. What is the probability that there is at most one car and at most one bus during a cycle?

c. What is the probability that there is exactly one car during a cycle? Exactly one bus?

d. Suppose the left-turn lane is to have a capacity of five cars, and that one bus is equivalent to three cars. What is t\({\rm{p(x,y)}} \ge {\rm{0}}\)e probability of an overflow during a cycle?

e. Are \({\rm{X}}\) and \({\rm{Y}}\) independent rv鈥檚? Explain.

a. Compute the covariance between \({\rm{X}}\) and\({\rm{Y}}\).

b. Compute the correlation coefficient \({\rm{\rho }}\) for this \({\rm{X}}\) and \({\rm{Y}}\).

See all solutions

Recommended explanations on Math Textbooks

View all explanations

What do you think about this solution?

We value your feedback to improve our textbook solutions.

Study anywhere. Anytime. Across all devices.