Chapter 3: Q48. (page 151)
Multiple Choice Which graph shows the solution of the inequality?
Short Answer
Correct option is D.
/*! This file is auto-generated */ .wp-block-button__link{color:#fff;background-color:#32373c;border-radius:9999px;box-shadow:none;text-decoration:none;padding:calc(.667em + 2px) calc(1.333em + 2px);font-size:1.125em}.wp-block-file__button{background:#32373c;color:#fff;text-decoration:none}
Learning Materials
Features
Discover
Chapter 3: Q48. (page 151)
Multiple Choice Which graph shows the solution of the inequality?
Correct option is D.
All the tools & learning materials you need for study success - in one app.
Get started for free
Amusement Parks You are trying to decide whether to pay \(120 for a season pass to an amusement park. If you buy the pass, you get an unlimited number of visits to the park and reduced parking for \)8. If you do not buy the pass, you pay \(23 admission and \)10 for parking each time you visit the park. After how many visits to the park will the cost of visiting with the season pass be less than cost of visiting without the season pass?
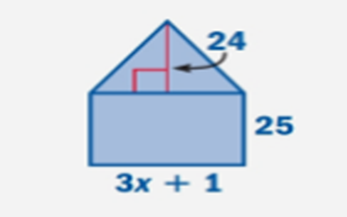
Challenge The figure shown is composed of a triangle and a rectangle. The figure has a total area of 1258 square units. Find the value of x.

Describe and correct the error in solving the equation
4x + 7 = x – 2
Solve the equation. Check your solution.
Solve the inequality. Graph your solution.
What do you think about this solution?
We value your feedback to improve our textbook solutions.