/*! This file is auto-generated */ .wp-block-button__link{color:#fff;background-color:#32373c;border-radius:9999px;box-shadow:none;text-decoration:none;padding:calc(.667em + 2px) calc(1.333em + 2px);font-size:1.125em}.wp-block-file__button{background:#32373c;color:#fff;text-decoration:none} Q.6 Yoonie is a personnel manager in... [FREE SOLUTION] | ÷ÈÓ°Ö±²¥

÷ÈÓ°Ö±²¥

Yoonie is a personnel manager in a large corporation. Each month she must review 16of the employees. From past experience, she has found that the reviews take her approximately four hours each to do with a population standard deviation of 1.2hours. Let Χ be the random variable representing the time it takes her to complete one review. Assume Χ is normally distributed. Let x-be the random variable representing the meantime to complete the 16reviews. Assume that the 16reviews represent a random set of reviews.

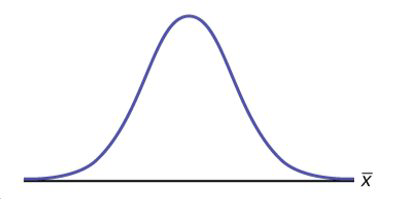
Find the 95th percentile for the meantime to complete one month's reviews. Sketch the graph.

a.
b. The 95th Percentile =____________

Short Answer

Expert verified

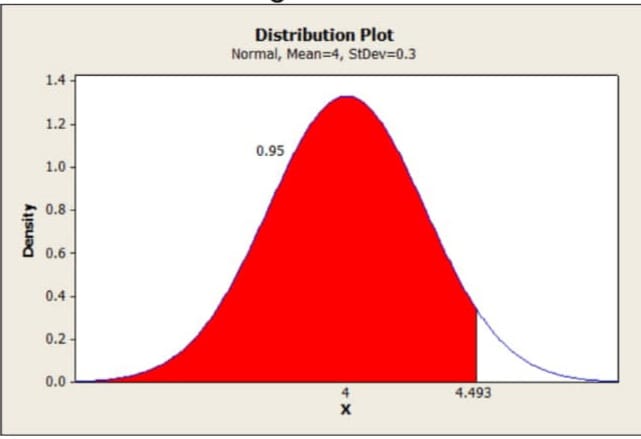
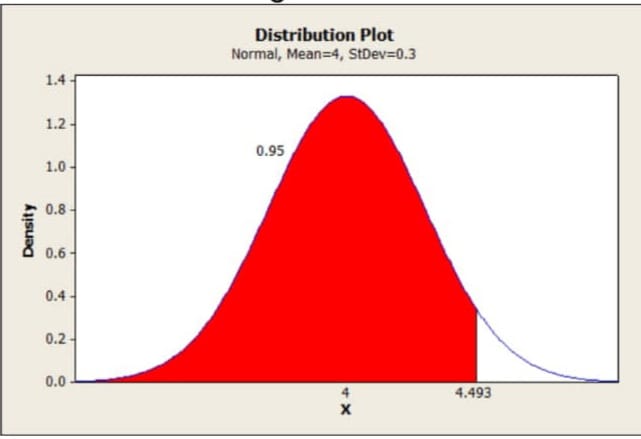
a) The95thpercentile is4.49hours and the graph is given below:

b)The value of 95th percentile for the meantime to complete one month review is 4.49hours.

Step by step solution

01

Given Information (part a)

According to the given details, the manager reviews 16employees each month. Thus, the meantime for each review is 4hours and the standard deviation is 1.2hours and the sample size is 16.

02

Explanation (part a)

Let's considerk=95thPrecentile,

The graph fork=95*Precentile is given as below:

In the above graph, the shaded area represents probability p(x<k)=0.95

03

Given Information (part b)

The 95th Percentile =____________

04

Step 5: Explanation (part b)

Let's use Ti-83 calculator to compute the 95th percentile for the meantime to meet one monthly review.

For this, click on localid="1648811383788" 2nd,then DISTR, and then scroll down to the inventory option and enter the provided details.

After that we need to click on ENTER button on the calculator to have the desired result.

05

Explanation (part b)

The screenshot is given below:
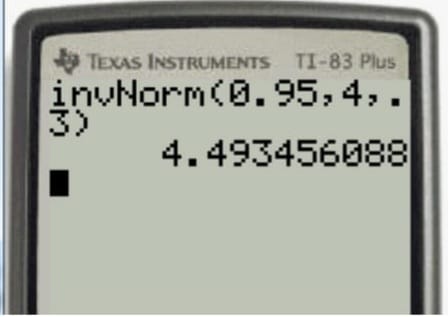
Therefore, the value of 95th percentile for the meantime to complete one month review is4.49hours.

Unlock Step-by-Step Solutions & Ace Your Exams!

  • Full Textbook Solutions

    Get detailed explanations and key concepts

  • Unlimited Al creation

    Al flashcards, explanations, exams and more...

  • Ads-free access

    To over 500 millions flashcards

  • Money-back guarantee

    We refund you if you fail your exam.

Over 30 million students worldwide already upgrade their learning with ÷ÈÓ°Ö±²¥!

One App. One Place for Learning.

All the tools & learning materials you need for study success - in one app.

Get started for free

Most popular questions from this chapter

Use the information in Example \(7.9\), but change the sample size to \(144\).

a. Find \(P(20<\bar{x}<30)\).

b. Find \(P(\sum x\) is at least \(3,000)\).

c. Find the \(75th\) percentile for the sample mean excess time of \(144\) customers.

The distribution of income in some Third World countries is considered wedge shaped (many very poor people, very few middle income people, and even fewer wealthy people). Suppose we pick a country with a wedge shaped distribution. Let the average salary be \(2,000per year with a standard deviation of \)8,000. We randomly survey 1,000residents of that country.

a. In words,Χ=_____________

b. In words,X=_____________

c.X¯~_____(_____,_____)

d. How is it possible for the standard deviation to be greater than the average?

e. Why is it more likely that the average of the 1,000residents will be from \(2,000to \)2,100than from \(2,100to\)2,200?

An unknown distribution has a mean of 25 and a standard deviation of six. Let X = one object from this distribution. What is the sample size if the standard deviation of ΣX is 42?

The percent of fat calories that a person in America consumes each day is normally distributed with a mean of about 36and a standard deviation of about ten. Suppose that 16individuals are randomly chosen. Let role="math" localid="1648361500255" X¯=average percent of fat calories.

a. X¯~_____ (______, ______)

b. For the group of 16, find the probability that the average percent of fat calories consumed is more than five. Graph the situation and shade in the area to be determined.

c. Find the first quartile for the average percent of fat calories.

Cans of a cola beverage claim to contain 16 ounces. The amounts in a sample are measured and the statistics are n=34,x¯=16.01ounces. If the cans are filled so that μ=16.00ounces (as labeled) and σ=0.143ounces, find the probability that a sample of 34 cans will have an average amount greater than 16.01ounces. Do the results suggest that cans are filled with an amount greater than 16 ounces?

See all solutions

Recommended explanations on Math Textbooks

View all explanations

What do you think about this solution?

We value your feedback to improve our textbook solutions.

Study anywhere. Anytime. Across all devices.