/*! This file is auto-generated */ .wp-block-button__link{color:#fff;background-color:#32373c;border-radius:9999px;box-shadow:none;text-decoration:none;padding:calc(.667em + 2px) calc(1.333em + 2px);font-size:1.125em}.wp-block-file__button{background:#32373c;color:#fff;text-decoration:none} Q. 100 100. We are interested in whethe... [FREE SOLUTION] | ÷ÈÓ°Ö±²¥

÷ÈÓ°Ö±²¥

100. We are interested in whether the proportions of female suicide victims for ages 15 to 24 are the same for the whites and the blacks races in the United States. We randomly pick one year, 1992, to compare the races. The number of suicides estimated in the United States in 1992 for white females is 4,930 . Five hundred eighty were aged 15 to 24 . The estimate for black females is 330 . Forty were aged 15 to 24 . We will let female suicide victims be our population.

Short Answer

Expert verified

(a) The null hypothesis: H0:PW=PB
(b) The alternate hypothesis: H0:PW≠PB
(c) The random variable is the proportion of white and black suicide victims between the ages of 15 and 24.
(d) For two proportions, normal.
(e) The test statistics -0.1944
(f) The p-value is 0.8458.
(g)(i) α=0.05
(ii) Decision: not to reject the null hypothesis.
(iii) Reason for Decision: α<p- value .
(iv) As a result: There is insufficient data to infer that the proportions of white and black female suicide victims, aged 15 to 24, are different at the 5%significance level.

Step by step solution

01

Given information

Let, the number of suicides estimated in the United States in 1992 for white females is 4,930. Five hundred eighty were aged 15 to 24.

02

Explanation

(a) The null hypothesis is indicated as:
H0:PW=PB
(b) The alternate hypothesis is indicated as:
H0:PW≠PB
(c) The random variable is the proportion of white and black suicide victims between the ages of 15 and 24.
(d) For two proportions, normal.
(e) To determine the test static as follows:
To access the stat list editor, click STAT and then 1.

Then ENTER all values the OUTPUT will be:

Hence, the test statistics is -0.1944.

03

Explanation

(f) The p-value from the output is determined as 0.8458.
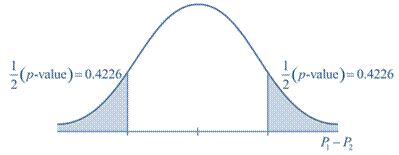
(g) Obtain a clear picture of the situation using the information from the last task.
The horizontal axis should be clearly labelled and scaled, and the region(s) corresponding to the p-value should be shaded on the graph.

(i) α=0.05
(ii) Decision: not to reject the null hypothesis.
(iii) Reason for Decision: α<p- value .
(iv) As a result: There is insufficient data to infer that the proportions of white and black female suicide victims, aged 15 to 24, are different at the 5%significance level.

Unlock Step-by-Step Solutions & Ace Your Exams!

  • Full Textbook Solutions

    Get detailed explanations and key concepts

  • Unlimited Al creation

    Al flashcards, explanations, exams and more...

  • Ads-free access

    To over 500 millions flashcards

  • Money-back guarantee

    We refund you if you fail your exam.

Over 30 million students worldwide already upgrade their learning with ÷ÈÓ°Ö±²¥!

One App. One Place for Learning.

All the tools & learning materials you need for study success - in one app.

Get started for free

Most popular questions from this chapter

Mean entry-level salaries for college graduates with mechanical engineering degrees and electrical engineering degrees are believed to be approximately the same. A recruiting office thinks that the mean mechanical engineering salary is actually lower than the mean electrical engineering salary. The recruiting office randomly surveys \(50\) entry level mechanical engineers and \(60\) entry level electrical engineers. Their mean salaries were \(\$46,100\) and \(\$46,700\), respectively. Their standard deviations were \(\$3,450\) and \(\$4,210\), respectively. Conduct a hypothesis test to determine if you agree that the mean

entry-level mechanical engineering salary is lower than the mean entry-level electrical engineering salary.

If the p-value is 0.0062 what is the conclusion (use α = 0.05)?

a. The method has no effect.

b. There is sufficient evidence to conclude that the method reduces the proportion of HIV positive patients who develop AIDS after four years.

c. There is sufficient evidence to conclude that the method increases the proportion of HIV positive patients who develop AIDS after four years.

d. There is insufficient evidence to conclude that the method reduces the proportion of HIV positive patients who develop AIDS after four years.

93. A study is done to determine if students in the California state university system take longer to graduate, on average, than students enrolled in private universities. One hundred students from both the California state university system and private universities are surveyed. Suppose that from years of research, it is known that the population standard deviations are 1.5811 years and 1 year, respectively. The following data are collected. The California state university system students took on average 4.5 years with a standard deviation of 0.8. The private university students took on average 4.1 years with a standard deviation of 0.3.

The known standard deviation in salary for all mid-level professionals in the financial industry is \(11,000. Company A and Company B are in the financial industry. Suppose samples are taken of mid-level professionals from Company A and from Company B. The sample mean salary for mid-level professionals in Company A is \)80,000. The sample mean salary for mid-level professionals in Company B is $96,000. Company A and Company B management want to know if their midlevel professionals are paid differently, on average.

Indicate if the hypothesis test is for :-

a. independent group means, population standard deviations, and/or variances known

b. independent group means, population standard deviations, and/or variances unknown

c. matched or paired samples

d. single mean

e. two proportions

f. single proportion

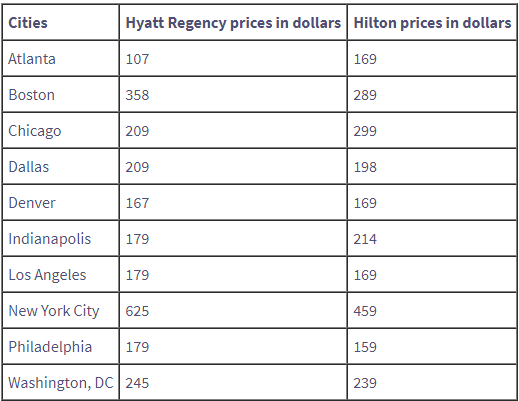
A traveler wanted to know if the prices of hotels are different in the ten cities that he visits the most often. The list of the cities with the corresponding hotel prices for his two favorite hotel chains is in Table 10.33. Test at the1% level of significance.

See all solutions

Recommended explanations on Math Textbooks

View all explanations

What do you think about this solution?

We value your feedback to improve our textbook solutions.

Study anywhere. Anytime. Across all devices.