Chapter 2: Q. 42 (page 133)
Find the mean for the following frequency tables
/*! This file is auto-generated */ .wp-block-button__link{color:#fff;background-color:#32373c;border-radius:9999px;box-shadow:none;text-decoration:none;padding:calc(.667em + 2px) calc(1.333em + 2px);font-size:1.125em}.wp-block-file__button{background:#32373c;color:#fff;text-decoration:none}
Learning Materials
Features
Discover
Chapter 2: Q. 42 (page 133)
Find the mean for the following frequency tables
All the tools & learning materials you need for study success - in one app.
Get started for free
When the data are skewed left, what is the typical relationship between the mean and median?
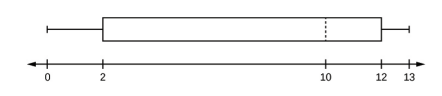
Given the following box plot:

Figure 2.41
a. which quarter has the smallest spread of data? What is that spread?
b. which quarter has the largest spread of data? What is that spread?
c. find the interquartile range (IQR).
d. are there more data in the interval 5–10 or in the interval 10–13? How do you know this?
e. which interval has the fewest data in it? How do you know this?
i. 0–2
ii. 2–4
iii. 10–12
iv. 12–13
v. need more information
The following data set shows the heights in inches for the boys in a class of students.
The following data set shows the heights in inches for the girls in a class of students.
Construct a box plot using a graphing calculator for each data set, and state which box plot has the wider spread for the middle of the data.
Listed are ages for Academy Award winning best actors in order from smallest to largest. a. Find the percentile.
b. Find the percentile.
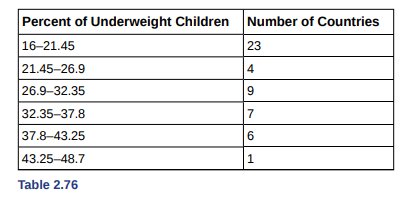
Table 2.76 gives the percent of children under five considered to be underweight.

What is the best estimate for the mean percentage of underweight children? What is the standard deviation? Which interval(s) could be considered unusual? Explain.
What do you think about this solution?
We value your feedback to improve our textbook solutions.