/*! This file is auto-generated */ .wp-block-button__link{color:#fff;background-color:#32373c;border-radius:9999px;box-shadow:none;text-decoration:none;padding:calc(.667em + 2px) calc(1.333em + 2px);font-size:1.125em}.wp-block-file__button{background:#32373c;color:#fff;text-decoration:none} Q. 2.19 For the 100-meter dash, the thir... [FREE SOLUTION] | ÷ÈÓ°Ö±²¥

÷ÈÓ°Ö±²¥

For the 100-meter dash, the third quartile for times for finishing the race was 11.5seconds. Interpret the third quartile in the context of the situation.

Short Answer

Expert verified

The 75th percentile 11.5seconds denotes seventy-five percent of runners finished the race in 11.5seconds or less and twenty-five percent of runners finished the race in11.5 seconds or more.

Step by step solution

01

Given

The third quartile for finishing times in the 100-meter dash was 11.5 seconds, according to the data.

02

Explanation

The partition values are the quartiles in statistics.
Thedataisdividedintofourequalsectionsusingquartiles.
The median is represented by the second quartile, and the data below this figure is worth $50percent of the total.
Similarly, the first quartile will contain 25%of the data below it and 75%of the data above it.
The data in the third quartile will be $75percent below it and $25percent above it.
The third quartile for the 100-meter dash is 11.5seconds in the provided scenario.
As a result, this third quartile number indicates that 75%of runners finished the race in 11.5seconds or less, while 25%finished in 11.5seconds or more.

Unlock Step-by-Step Solutions & Ace Your Exams!

  • Full Textbook Solutions

    Get detailed explanations and key concepts

  • Unlimited Al creation

    Al flashcards, explanations, exams and more...

  • Ads-free access

    To over 500 millions flashcards

  • Money-back guarantee

    We refund you if you fail your exam.

Over 30 million students worldwide already upgrade their learning with ÷ÈÓ°Ö±²¥!

One App. One Place for Learning.

All the tools & learning materials you need for study success - in one app.

Get started for free

Most popular questions from this chapter

An elementary school class ran one mile with a mean of 11 minutes and a standard deviation of three minutes. Rachel, a student in the class, ran one mile in eight minutes. A junior high school class ran one mile with a mean of nine minutes and a standard deviation of two minutes. Kenji, a student in the class, ran 1 mile in 8.5 minutes. A high school class ran one mile with a mean of seven minutes and a standard deviation of four minutes. Nedda, a student in the class, ran one mile in eight minutes.

a. Why is Kenji considered a better runner than Nedda, even though Nedda ran faster than he?

b. Who is the fastest runner with respect to his or her class? Explain why.

Listed are 32ages for Academy Award winning best actors in order from smallest to largest. 18;18;21;22;25;26;27;29;30;31;31;33;36;37;37;41;42;47;52;55;57;58;62;64;67;69;71;72;73;74;76;77a. Find the percentile of 37.

b. Find the percentile of 72.

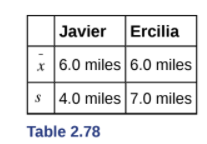
Javier and Ercilia are supervisors at a shopping mall. Each was given the task of estimating the mean distance that shoppers live from the mall. They each randomly surveyed 100shoppers. The samples yielded the following information.

a. How can you determine which survey was correct ?

b. Explain what the difference in the results of the surveys implies about the data.

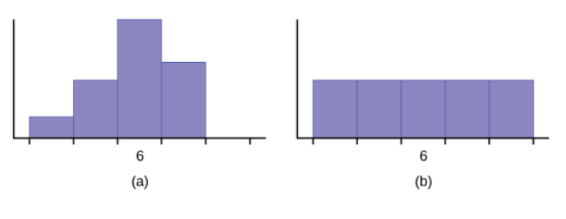
c. If the two histograms depict the distribution of values for each supervisor, which one depicts Ercilia's sample? How do you know?

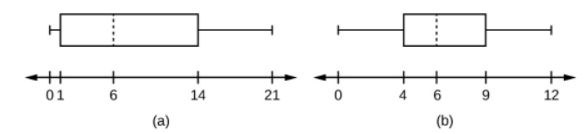
d. If the two box plots depict the distribution of values for each supervisor, which one depicts Ercilia’s sample? How do you know?

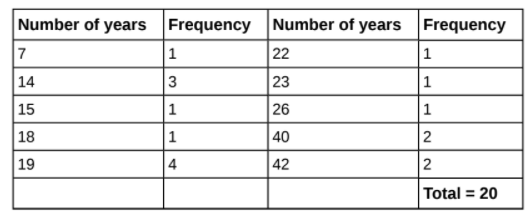
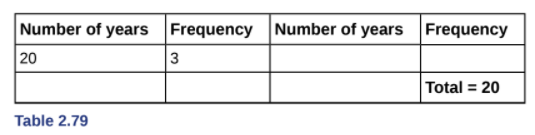
Use the following information to answer the next three exercises: We are interested in the number of years students in a particular elementary statistics class have lived in California. The information in the following table is from the entire section.

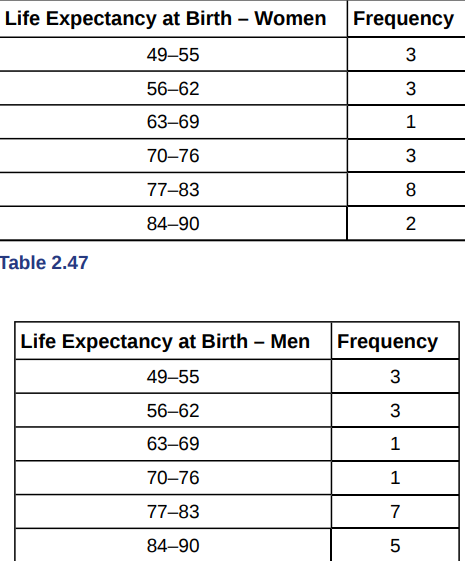
Use the two frequency tables to compare the life expectancy of men and women from 20randomly selected countries. Include an overlayed frequency polygon and discuss the shapes of the distributions, the center, the spread, and any outliers. What can we conclude about the life expectancy of women compared to men?

What does the relative frequency column in Table 2.42 sum to? Why?

See all solutions

Recommended explanations on Math Textbooks

View all explanations

What do you think about this solution?

We value your feedback to improve our textbook solutions.

Study anywhere. Anytime. Across all devices.