Chapter 8: Q.19 (page 478)
In complete sentences, explain why the confidence interval in Exercise 8.17 is larger than in Exercise 8.18.
Short Answer
A larger confidence level results in larger areas and larger intervals.
/*! This file is auto-generated */ .wp-block-button__link{color:#fff;background-color:#32373c;border-radius:9999px;box-shadow:none;text-decoration:none;padding:calc(.667em + 2px) calc(1.333em + 2px);font-size:1.125em}.wp-block-file__button{background:#32373c;color:#fff;text-decoration:none}
Learning Materials
Features
Discover
Chapter 8: Q.19 (page 478)
In complete sentences, explain why the confidence interval in Exercise 8.17 is larger than in Exercise 8.18.
A larger confidence level results in larger areas and larger intervals.
All the tools & learning materials you need for study success - in one app.
Get started for free
120. An article regarding interracial dating and marriage recently appeared in the Washington Post. Of therandomly selected adults, identified themselves as Latinos, identified themselves as blacks, identified themselves as Asians, and identified themselves as whites. In this survey, of blacks said that they would welcome a white person into their families. Among Asians, would welcome a white person into their families, would welcome a Latino, and would welcome a black person.
a. We are interested in finding the confidence interval for the percent of all black adults who would welcome a white person into their families. Define the random variables role="math" localid="1650173946070" and , in words.
b. Which distribution should you use for this problem? Explain your choice.
c. Construct a confidence interval.
i. State the confidence interval.
ii. Sketch the graph.
iii. Calculate the error bound.
When designing a study to determine this population proportion, what is the minimum number you would need to survey to be confident that the population proportion is estimated to within ?
Construct a confidence interval for the population mean time to complete the forms. State the confidence interval, sketch the graph and calculate the error bound.
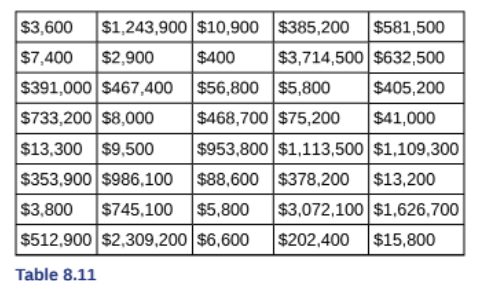
The Federal Election Commission collects information about campaign contributions and disbursements for
candidates and political committees each election cycle. During the campaign season, there were candidates for
the House of Representatives across the United States who received contributions from individuals. Table shows the
total receipts from individuals for a random selection of House candidates rounded to the nearest . The standard
deviation for this data to the nearest hundred is .
a. Find the point estimate for the population mean.
b. Using confidence, calculate the error bound.
c. Create aconfidence interval for the mean total individual contributions.
d. Interpret the confidence interval in the context of the problem.
A poll of 1,200 voters asked what the most significant issue was in the upcoming election. Sixty-five percent answered the economy. We are interested in the population proportion of voters who feel the economy is the most important.
Define the random variable P′ in words.
What do you think about this solution?
We value your feedback to improve our textbook solutions.
