/*! This file is auto-generated */ .wp-block-button__link{color:#fff;background-color:#32373c;border-radius:9999px;box-shadow:none;text-decoration:none;padding:calc(.667em + 2px) calc(1.333em + 2px);font-size:1.125em}.wp-block-file__button{background:#32373c;color:#fff;text-decoration:none} Q.10.128 Cooling Down. Cooling down with ... [FREE SOLUTION] | ÷ÈÓ°Ö±²¥

÷ÈÓ°Ö±²¥

Cooling Down. Cooling down with a cold drink before exercise in the heat is believed to help an athlete perform. Researcher 1. Dugas explored the difference between cooling down with an ice slurry (slushy) and with cold water in the article "lce Slurry Ingestion Increases Running Time in the Heat" (Clinical Journal of Sports Medicine, Vol. 21, No, 6, pp. 541-542). Ten male participants drank a flavored ice slurry and ran on a treadmill in a controlled hot and humid environment. Days later, the same participants drank cold water and ran on a treadmill in the same bot and humid environment. The following table shows the times, in minutes, it took to fatigue on the treadmill for both the ice slurry and the cold water.
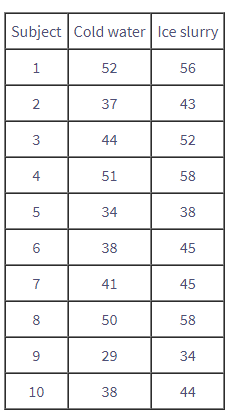
At the 1%significance level, do the data provide sufficient evidence to conclude that, on average, cold water is less effective than ice slurry For optimizing athletic performance in the heat? (Note; The mean and standard deviation of the paired differences are -5.9minutes and 1.60minutes, respectively.)

Short Answer

Expert verified

The null hypothesis is rejected, and the findings support the conclusion that, on average, cold water is less beneficial than ice slurry for improving athletic performance in hot weather.

Step by step solution

01

Given Information

Given table is:

we have to explain Whether the data provide sufficient evidence to conclude that on average cold water is less effective than ice slurry for optimizing athletic performance in heat.

02

Explanation

The null and alternative hypothesis are :

H0:μd=0

Ha:μd<0

the MINITAB output is shown below:

-11.70,0are the test statistics and p-values.

Because the p-value is smaller than the significance level,

Unlock Step-by-Step Solutions & Ace Your Exams!

  • Full Textbook Solutions

    Get detailed explanations and key concepts

  • Unlimited Al creation

    Al flashcards, explanations, exams and more...

  • Ads-free access

    To over 500 millions flashcards

  • Money-back guarantee

    We refund you if you fail your exam.

Over 30 million students worldwide already upgrade their learning with ÷ÈÓ°Ö±²¥!

One App. One Place for Learning.

All the tools & learning materials you need for study success - in one app.

Get started for free

Most popular questions from this chapter

Gasoline Additive. This exercise shows what can happen when a hypothesis-testing procedure designed for use with independent samples is applied to perform a hypothesis test on a paired sample. The gas mileages, in miles per gallon (mpg), of 10 randomly selected cars, both with and without a new gasoline additive, are shown in the following table.

  1. Apply the paired t-test to decide, at the 5%significance level, whether the gasoline additive is effective in increasing gas mileage.
  2. Apply the pooled t-test to the sample data to perform the hypothesis test.
  3. Why is performing the hypothesis test the way you did in part (b) inappropriate?
  4. Compare your result in parts (a) and (b).

State one possible advantage of using paired samples instead of independent samples.

Measuring Treadwear. R. Stichler et al. compared two methods of measuring treadwear in their paper "Measurement of Treadwear of Commercial Tires" (Rubber Age, Vol. 73:2). Eleven tires were each measured for treadwear by two methods, one based on weight and the other on groove wear. The data, in thousands of miles, are as follows.

At the5% significance level, do the data provide sufficient evidence to conclude that, on average, the two measurement methods give different results?

In each of Exercises 10.35-10.38, we have provided summary statistics for independent simple random samples from two populations. Preliminary data analyses indicate that the variable under consideration is normally distributed on each population. Decide, in each case, whether use of the pooled t-lest and pooled t-interval procedure is reasonable. Explain your answer.

10.36 x¯1=115.1,s1=79.4,n1=51
x¯2=24.3,s2=10.5,n2=19

The Federal Bureau of Prisons publishes data in Prison Statistics on the times served by prisoners released from federal institutions for the first time. Independent random samples of released prisoners in the fraud and firearms offense categories yielded the following information on time served, in months.

At the 5% significance level, do the data provide sufficient evidence to conclude that the meantime served for fraud is less than that for firearms offenses? (Note: x¯1=10.12,s1=4.90,x¯2=18.78, and s2=4.64.)

See all solutions

Recommended explanations on Math Textbooks

View all explanations

What do you think about this solution?

We value your feedback to improve our textbook solutions.

Study anywhere. Anytime. Across all devices.