/*! This file is auto-generated */ .wp-block-button__link{color:#fff;background-color:#32373c;border-radius:9999px;box-shadow:none;text-decoration:none;padding:calc(.667em + 2px) calc(1.333em + 2px);font-size:1.125em}.wp-block-file__button{background:#32373c;color:#fff;text-decoration:none} 10QQ Maude’s labor-supply curve slo... [FREE SOLUTION] | ÷ÈÓ°Ö±²¥

÷ÈÓ°Ö±²¥

Maude’s labor-supply curve slopes upward if, for Maude,

  1. leisure is a normal good

  2. consumption is a normal good

  3. the income effect on leisure exceeds the substitution effect.

  4. the substitution effect on leisure exceeds the income effect.

Short Answer

Expert verified

The correct option is d) the substitution effect on leisure exceeds the income effect.

Step by step solution

01

Explaining the labor supply curve

The labor supply curve is upward when the income is low and downward sloping when the income is high. The labor supply curve is shown below:

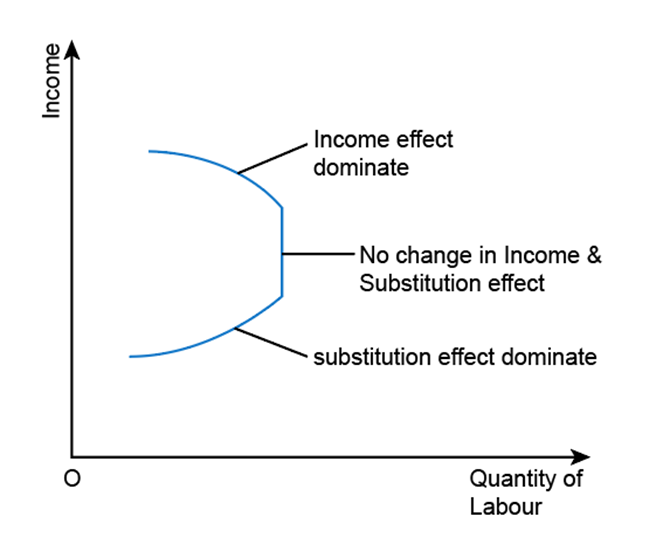
At a low level of income, the substitution effect is more than the income effect; thus, the labor supply increases with a rise in income. Leisure becomes more costly, and a person prefers working more. This is the upward sloping phase of the labor supply curve.

When the income is very high, the income effect dominates the substitution effect. People find working as an inferior good and, hence, increase the consumption of normal good, enjoying more leisure activities. This is where the downward sloping phase of labor supply curve occurs.

Thus, a labor supply curve is upward sloping only when the substitution effect is greater than the income effect.

Unlock Step-by-Step Solutions & Ace Your Exams!

  • Full Textbook Solutions

    Get detailed explanations and key concepts

  • Unlimited Al creation

    Al flashcards, explanations, exams and more...

  • Ads-free access

    To over 500 millions flashcards

  • Money-back guarantee

    We refund you if you fail your exam.

Over 30 million students worldwide already upgrade their learning with ÷ÈÓ°Ö±²¥!

One App. One Place for Learning.

All the tools & learning materials you need for study success - in one app.

Get started for free

Most popular questions from this chapter

Pick a point on an indifference curve for wine and cheese and show the marginal rate of substitution. What does the marginal rate of substitution tell us?

Homer buys pizza for \(10 and Pepsi for \)2. He has income of \(100. His budget constraint will shift inward if.

a. the price of pizza rises to \)12.

b. the price of Pepsi falls to \(1

c. his income rises to \)150

d. the price of pizza, the price of Pepsi and his income all rise by 50 percent.

Maya divides her income between coffee and croissants (both of which are normal goods). An early frost in Brazil causes a large increase in the price of coffee in the United States.

a. Show the effect of the frost on Maya’s budget constraint.

b. Show the effect of the frost on Maya’s optimal consumption bundle, assuming that the substitution effect outweighs the income effect for croissants.

c. Show the effect of the frost on Maya’s optimal consumption bundle, assuming that the income effect outweighs the substitution effect for croissants.

Show a consumer’s budget constraint and indifference curves for wine and cheese. Show the optimal consumption choice. If the price of wine is \(3 per glass and the price of cheese is \)6 per pound, what is the marginal rate of substitution at this optimum?

The price of cheese rises from \(6 to \)10 per pound, while the price of wine remains \(3 per glass. For a consumer with a constant income of \)3,000, show what happens to consumption of wine and cheese. Decompose the change into income and substitution effects.

See all solutions

Recommended explanations on Economics Textbooks

View all explanations

What do you think about this solution?

We value your feedback to improve our textbook solutions.

Study anywhere. Anytime. Across all devices.