Chapter 14: Q. 10 (page 319)
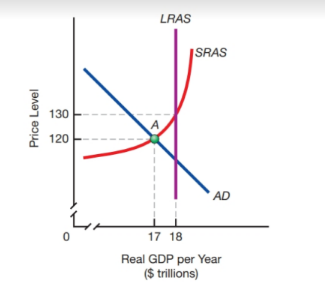
Suppose that the economy is experiencing the short-run equilibrium position depicted at point in the diagram below. Explain the short-run effects of an increase in the government deficit on equilibrium real and the equilibrium price level. What will be the long-run effects?
Short Answer
The short-run effects of an increase in the government deficit on equilibrium real price level, potential output and employment will also comeback to its natural level.
Step by step solution
Government budget.
The estimate of government expenditure and revenue is referred to as the government budget. The government spending category comprises both developmental and non-developmental expenditures. Tax revenue generated from people and businesses in the economy is included in the government's receipt.
Equilibrium level.
In the short run, prices in the economy are sticky or fixed, but in the long run, they are entirely flexible. This means that in the short run, prices do not fully adjust to the situation of the economic, whereas in the long run, prices fully respond to the status of the economy. In the long run, all sectors of the economy have full capital and labor mobility.
When enough time has passed and there are no fixed factors, the aggregate supply will shift from short-run to long-run. If the modification causes equilibrium to be disrupted, the equilibrium level is compared to the new short-run and long-run equilibrium levels.
Explanation by Diagram.
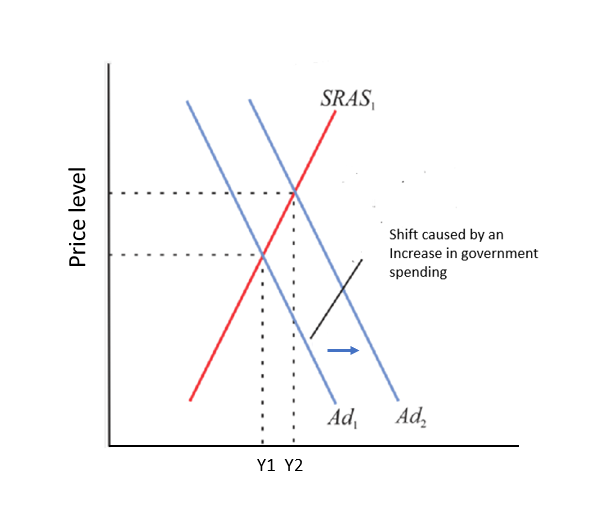
When the government's deficit rises, the government's borrowing will rise as well. As a result, spending rises as well. As a result, aggregate demand will rise. Other changes are considered to have no effect on , therefore this increase in government spending will push the curve to the right. The graphic below illustrates this point.
Explanation of GDP per year.
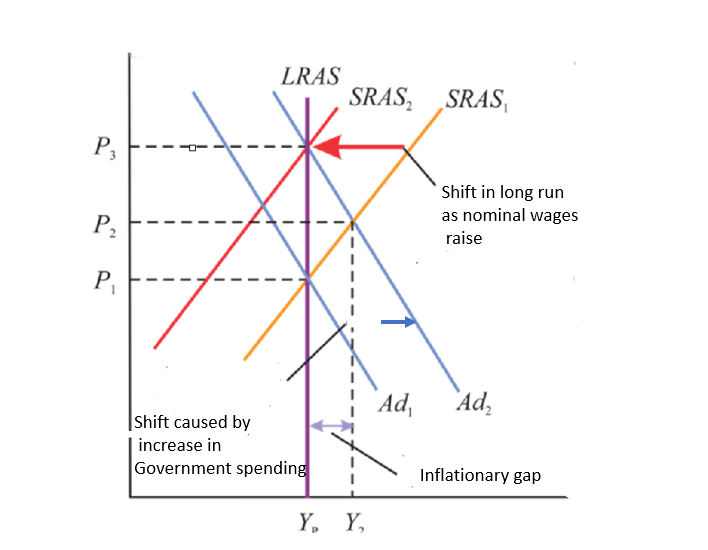
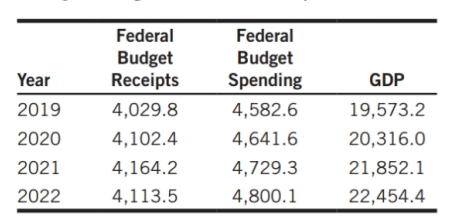
Inflationary gap of will result from the short term equilibrium. When prices and nominal wages rise in the long run, the shifts to the . Real has returned to its potential. Now that one of the other components of aggregate demand has increased at every price level, the will rise even more.
The aggregate demand curve moves from to when government spending rises. The price level rises from to , while real rises from to . As a result, in the short run, the equilibrium will be at the position where overlaps .
Potential Output.
Now, when this increased price level is combined with a fixed nominal wage, the actual wage will be lower. Firms will hire more workers in order to produce a higher volume of output than before. The economy's new output level, , will be higher than its potential output. As a result, employment will rise above its natural level.
The economy with output of and a price level of is only in short-run equilibrium; an inflationary gap equal to the difference between and will exist. Because real is over potential, prices will be forced to climb even further.
Inflationary gap.
As workers struggle to reclaim their lost purchasing power, the nominal wage will eventually rise. The curve will begin to alter when the nominal wage rises.
Away from the center, It will continue to shift to the extent that the nominal wage rises, and the nominal wage will rise to the extent that there is an inflationary gap.
These SRAS movements, on the other hand, will reduce real GDP, causing the gap to widen and employment to return to its natural level. As a result, these modifications will close the inflationary gap.
Over 30 million students worldwide already upgrade their learning with ��Ӱֱ��!